What is Pivot Table in Excel?
Pivot Table is a dynamic and interactive tool in Microsoft Excel that allows you to summarize and analyze large datasets quickly. It provides a flexible way to organize and manipulate data, making it easier to identify patterns, trends, and outliers. Unlike traditional tables, Pivot Tables enable users to rearrange and reorganize data effortlessly, making them an invaluable asset for anyone dealing with extensive datasets.
In the realm of data analysis and spreadsheet magic, Excel’s Pivot Tables stand as a beacon of efficiency and insights. Whether you’re a seasoned Excel user or just starting your spreadsheet journey, understanding what a Pivot Table is and how to use it can revolutionize the way you analyze and visualize data. In this guide, I’ll unravel the mysteries behind Pivot Tables, exploring their functionalities and showcasing their potential for transforming raw data into meaningful information.
Understanding the Power of Pivot Tables in Excel
When you have a large sales dataset with thousands of rows of information, such as invoice date, invoice number, salesperson, sales figure, VAT, etc., it becomes obvious that you need a pivot table.
A pivot table is an essential tool when you want to create a detailed sales summary that is categorized by factors such as region. It also allows you to apply filters and directly create visual representations via charts.
Without a pivot table, it would take a lot of time and effort to analyze data from a large dataset.
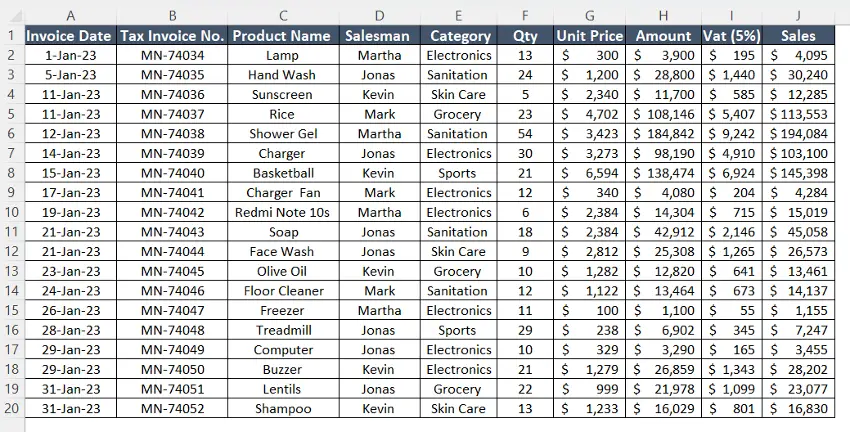
Now, I have a sales report with multiple rows and columns of data. First, look at the dataset without using a pivot table.
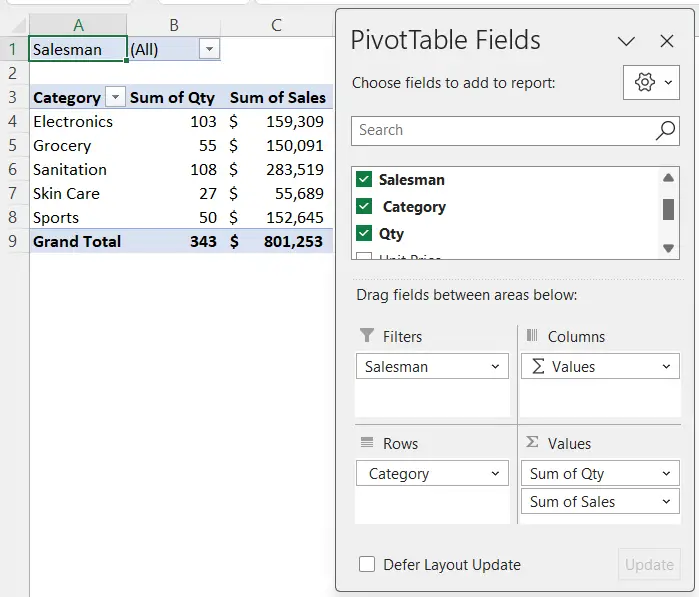
After applying the pivot table, see how it becomes so easy to get insights from the messy data. From the pivot table report, I can easily get the “Sum of Sales” against each category of product. The report also summarizes the total number of products under each category. This means the pivot table report automatically does a lot of basic calculations that help understand data better.
Why is It Called a Pivot Table?
A pivot table allows the users to pivot or rotate data from one orientation to another. Users can change the settings of a table by reorganizing the data. You can pivot or rotate the rows into columns, columns into rows, move data fields, and apply filters to see the summarized data.
A pivot table allows a user to pivot data and change the data elements as well as the arrangement. This is why, it is called a pivot table.
What is a Pivot Table Used for?
A pivot table is used for analyzing and summarizing large amounts of data. There are various uses of a pivot table except for summarization and analysis. Users can customize calculations, filtering, visualization, etc.
A pivot table is used for the following purposes:
- Calculate totals, averages, counts, percentages, and other summary statistics for your data.
- Pivot, rearrange, and filter data to achieve patterns and trends.
- Group and categorize data based on specific criteria.
- Perform calculations within a Pivot Table, including mathematical operations and custom formulas.
- Visualize data patterns and trends by creating charts and graphs directly from the pivot table.
- Present data in a clear and organized format.
- Do a comparative analysis between different trends and categories.
What is the Minimum Requirement to Create a Pivot Table?
You can convert your data table into a pivot table. However, your data should be structured appropriately.
To create a pivot table in Excel, you must meet some requirements:
- The heading of each column should be in the same row.
- Each column should have a heading.
- No merged cells should not be present in the table.
- Remove subtotals or grand totals from the dataset.
- Avoid empty rows or columns.
- Select the entire range of data from the data table.
After creating a pivot table, don’t change the column headers. It may remove the values within the pivot table.
Sample Excel Data for Pivot Table
A pivot table has several features to deal with the dataset. To demonstrate that, I have prepared a dataset of sales reports.
Here I have included the details of the products such as invoice data, invoice number, salesman, and category with their sales, VAT, and total amount of the products.
By a sales report dataset, users can analyze the performance of sales efforts of an organization. On top of that, they can also identify trends, patterns, and best-selling products. Furthermore, they can set monthly or yearly goals regarding that.
From this dataset, I will create a pivot table. Then, I will summarize and analyze the data based on the category. After that, I will identify the trend and pattern of a specific category in the later part. In addition to that, I will include the sorting of data.
Create a Pivot Table in Excel
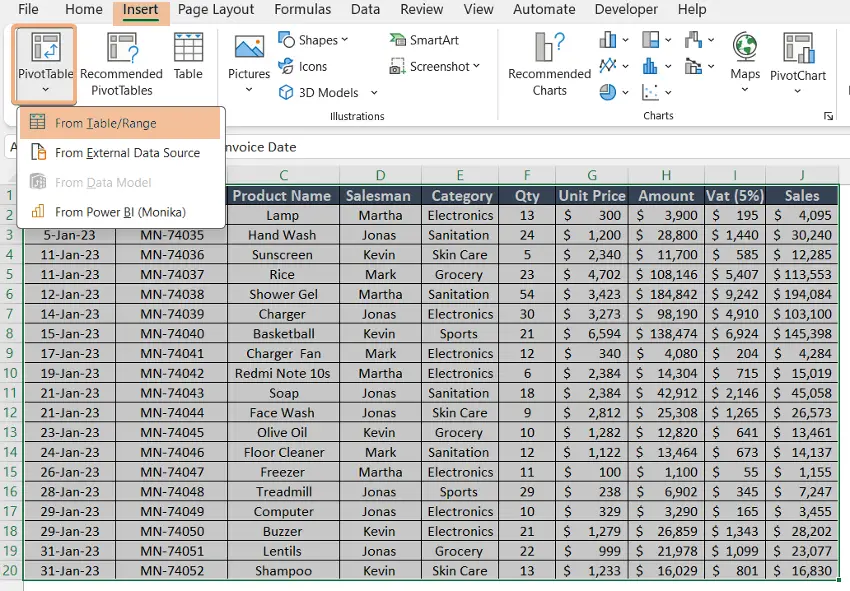
To create a pivot table in Excel, follow these steps:
- Select the range of data.
- Go to Insert tab.
- Click on the dropdown of PivotTable.
- Select From Table/Range option.
- Choose New Worksheet from the “PivotTable from table or range” dialog box.
- Now, click OK.

Now, you have created a pivot table. Choose the fields from PivotTable Fields.
Here, I have added “Category” under the “Rows” section. In the Values section, I have added the “Sum of Quantity” and the “Sum of Sales”.
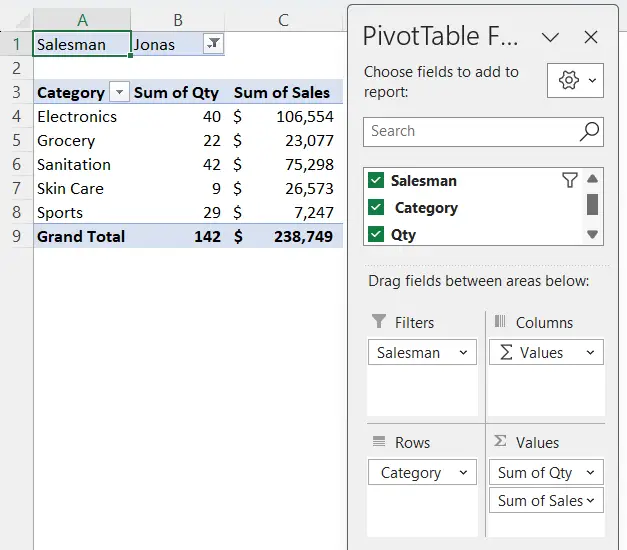
I have filtered the data for the salesman to observe the performance.
What is the Difference Between a Table and a Pivot Table in Excel?
Excel tabular table contains all the data of a dataset and organizes it into rows and columns. It has structured column headers where each row contains a record. We can use a table for data entry and storage.
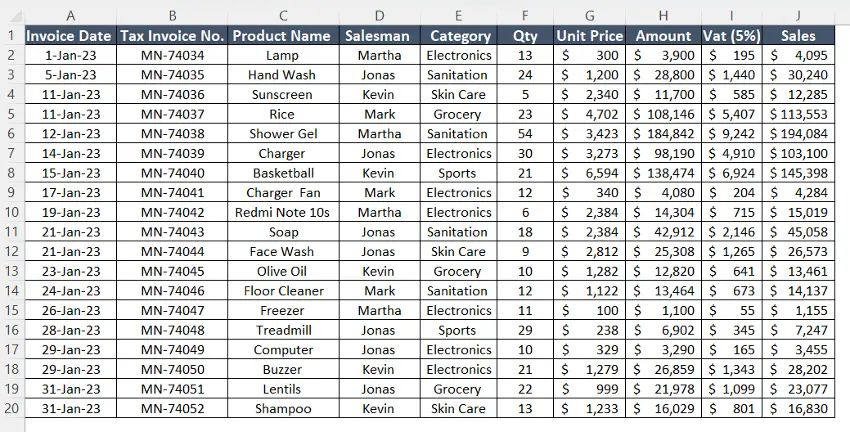
Here is a structured table where I have stored the sales records.
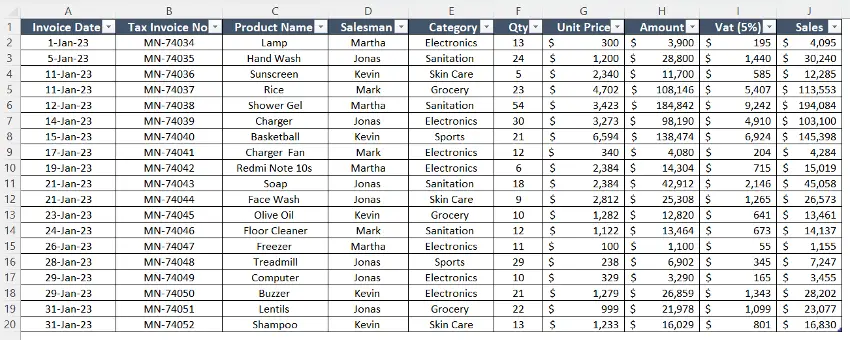
We can create a pivot table from an existing dataset in tabular format. Pivot tables summarize and analyze data efficiently. Now, we will see how a pivot table differs from a tabular table in Excel.
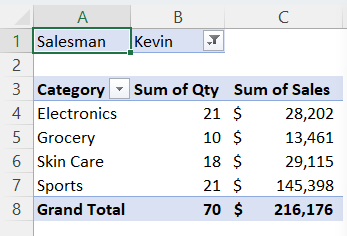
From these above images, we can see the differences. To be precise, when I wanted the data of salesman Kevin, I added the salesman header in the filters section of the pivot table.
In a tabular table, if we apply a filter of a salesman, we still have to check all the columns. On the contrary, we can see a summarized sales report for a specific section from the pivot table. We can see the details of four columns in a column by using a pivot table.
Do Pivot Tables Slow Excel?
Pivot tables can slow down the program in Excel. When you create a pivot table, Excel stores a cache of the source data in the file to improve performance during data analysis and queries. However, this caching can lead to larger file sizes and slower performance if you create separate pivot tables for the same data table multiple times.
To resolve this issue for a file, you can create a single pivot table. Then copy the pivot for all other pivots. Use the same data table for all pivot tables within a file. This approach will make your data management easier and more efficient.
What is the Benefit of Excel Pivottable?
Pivot tables in Excel summarize the data quickly. Additionally, you can analyze the data within a few seconds. You can sort data as per your wish. Besides that, pivot tables in Excel also offer to create a dashboard with slicers, charts, and other elements to analyze data easily. Pivot tables update the data by only clicking on refresh in the Excel ribbon. Moreover, the error rate gets lower by using pivot tables.
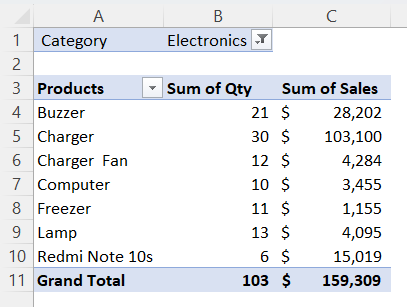
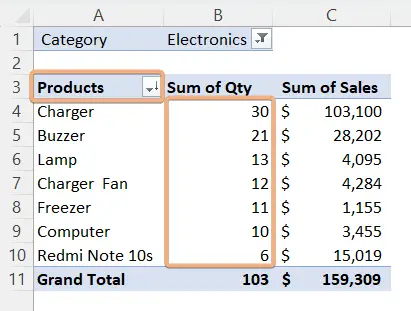
- Summarize the dataset: In this dataset, I have taken a summary of the product category Electronics. If I need any more information, I can add it by PivotTable Fields.

- Sorting Data: You can sort the data in the pivot table by right-clicking on the first cell of the table. Then, go to Sort Options choose the column name and sort in ascending or descending order.
Here, I have sorted the column sum of quantity by descending order to check which product is the best selling in the electronics category.

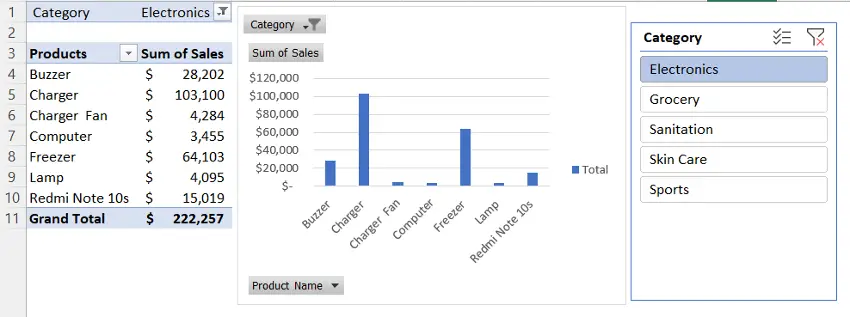
- Creating Dashboards: You can easily analyze data, trends, and patterns by creating a dashboard with charts, slicers, and other elements. Here, I have created a dashboard to view the trends and patterns in Excel inserting a chart and slicer.

- Update Data: If you change any data in an Excel workbook, you can just refresh the file. To update data, go to PivotChartAnalyze, and click on Refresh command from Data It will automatically update the pivot table.
With the help of a pivot table, your hassle while dealing with a large dataset will be reduced. You can minimize the errors by these techniques and tools.
What Are the Limitations of Pivot Tables?
Even though pivot tables offer numerous advantages, they also have several limitations in Excel. You will encounter the following limitations while dealing with pivot tables in Excel:
- Record Limit: Pivot tables have a maximum limit of 500,000 records.
- Field Combination Limit: You can create 40 row and column combinations in a pivot table. If you have 20 rows, you can have 20 column field values. If you have 10 rows, you can have 30 column field values.
- Nonaggregated Values: You can apply calculation in nonaggregated values. This means that if you have any calculated fields, you cannot apply pivot table calculation.
- Custom Metric Limitation: If you are using custom metrics for sorting, you cannot apply table calculation. To apply table calculation, remove the custom metric.
- Totals and Subtotals: For aggregated metrics, totals and subtotals may appear blank.
Conclusion
In conclusion, a Pivot Table in Excel is a game-changer for data analysis. By providing a flexible and dynamic environment, Pivot Tables empowers users to extract meaningful insights from large datasets with ease. Whether you’re a business analyst, financial professional, or a student, mastering the art of Pivot Tables is a skill that can significantly boost your productivity and decision-making capabilities in Excel. So, dive in, experiment with your data, and unlock the full potential of Pivot Tables in Excel.
Frequently Asked Questions
What is the purpose of a pivot table in Excel?
The purpose of a Pivot Table in Excel is to simplify complex data by providing a powerful tool for data analysis, summarization, and visualization. It allows users to quickly organize, filter, and calculate data to gain insights, spot trends, and make informed decisions. Pivot Tables enhance data clarity and facilitate effective reporting and decision-making.
Why do we pivot data?
In Excel, we pivot data to reorganize and summarize it in a way that makes it easier to analyze, visualize, and draw insights. Pivoting data transforms it from a flat table into a structured format that simplifies complex datasets, allowing for better data analysis, reporting, and decision-making.
What are the four components of a Pivot Table?
To create a pivot table, the four key components of a Pivot Table are Rows, Columns, Values, and Filters.
- Rows: These represent the categories or items you want to analyze. They form the vertical structure of the Pivot Table.
- Columns: Columns help organize and categorize data horizontally, often providing additional insights.
- Values: These are the data points you want to analyze, such as sums, averages, or counts. They form the core of your analysis.
- Filters: Filters allow you to narrow down the data displayed in the Pivot Table based on specific criteria or conditions. They help you focus on the most relevant information.
Excel Glossary | Autosum | Fill Handle | Conditional Formatting | Merge & Center | Wrap Text | Flash Fill | Find & Replace | Freeze Panes | Format Painter | Format Cells | Sort & Filter | Advanced Filter | Text to Columns | Go To Special | Calculation Options | Name Manager | Excel Table | Slicer | Power Query | Add-ins

Please share excel workbook for practice
Download the workbook from this link: https://excelgraduate.com/wp-content/uploads/2022/07/Pivot-Table.xlsx