What is a Table in Excel?
How to Insert a Table in Excel
To insert a table in Excel, follow the steps below:
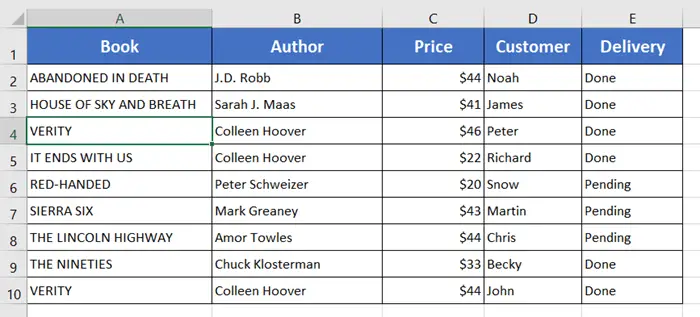
- Select a cell from the dataset.
I have selected cell A4.
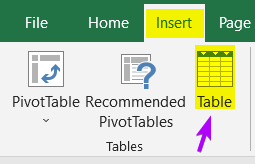
- Then navigate to Insert tab > Tables group > Table command.
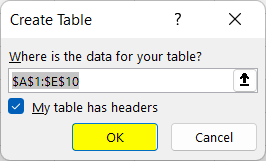
 The Create Table window will come along on the screen. You can also press CTRL+T to open the Create Table dialog box. There you will see Excel has already selected the cell range automatically.
 - Check the ‘My table has headers’ checkbox has a tickmark.
- Now click on the OK button.
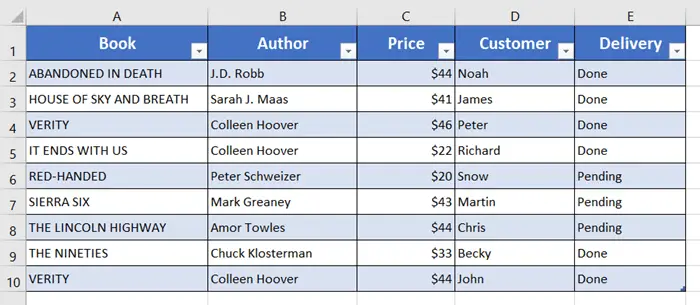
 You will see the table is set with a color theme. Change the color theme if you want,
 - Click on the Table Design tab.
- From the Table Styles group, click on the drop-down button.

- Now select a style from the vast collection.
I have chosen this blue theme.
Applications of a Table in Excel
The main function of an Excel Table is to sort, filter, and apply formulas in the table data quickly.
1. Sort
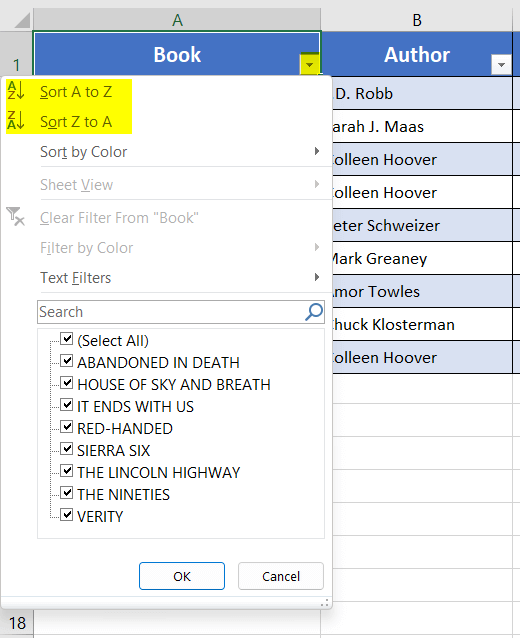
If the column contents are alphabetic, click on the small down arrow beside the column header.
There you will find the options to sort the data alphabetically: Sort A to Z and Sort Z to A.
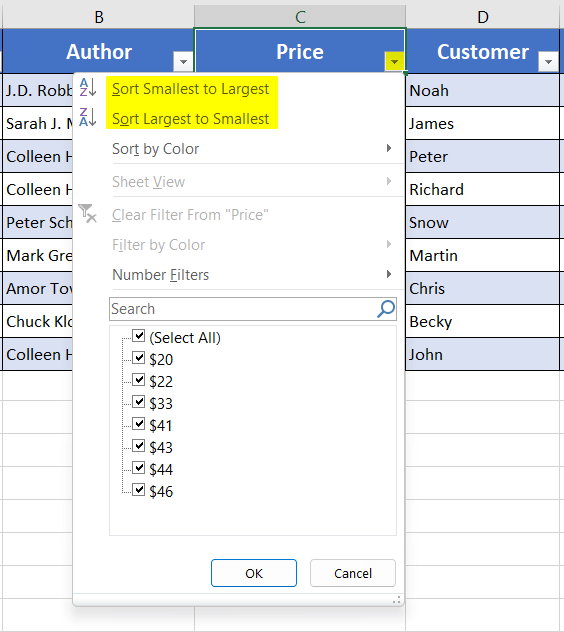
I have another column for Prices, and the column contents are numeric.
Click on the small down arrow in the column header. Now sort with: Sort Smallest to Largest and Sort Largest to Smallest options.
2. Filter
You can also filter the data from the table in Excel. To do so,
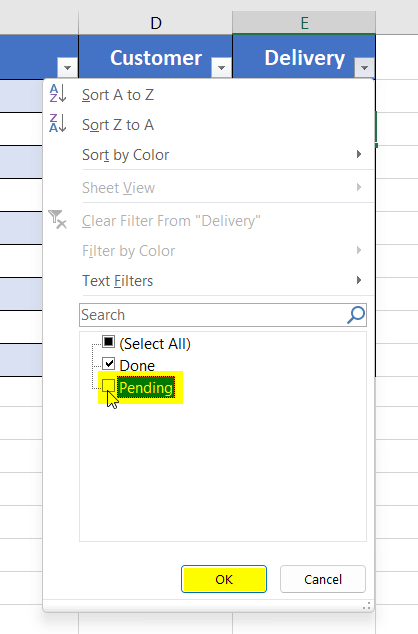
- Click on the drop-down menu beside the table headers.
You will find the column content names with a checkbox in the bottom part of the drop-down menu. - Keep the tick-mark for only those contents that you want to keep and remove the tick-mark for the rest of the checkboxes.
- From the Delivery items, I will only keep the items that have their Delivery Done. So I unchecked the box of Pending Delivery.
- Finally, click the OK button.
 See only the Delivery Done items are shown now.
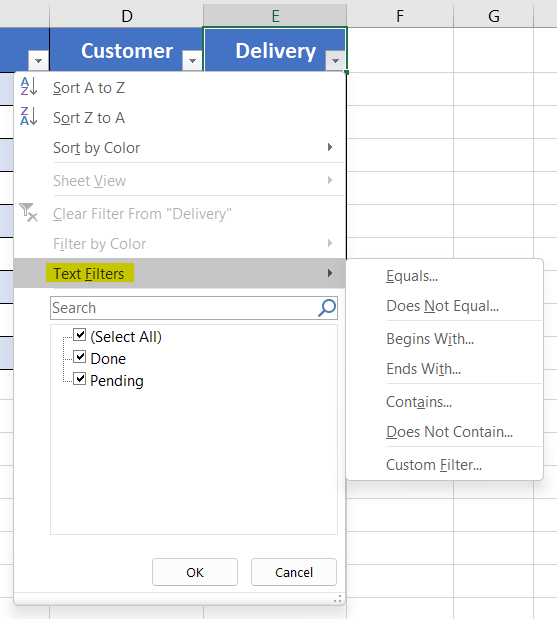
 You can also filter the table contents with the Text Filters menu.
3. Total Row
You can also count the total number of rows with the table in Excel. To do that,
- Click on a cell of your table.
- Go to the Table Design tab.
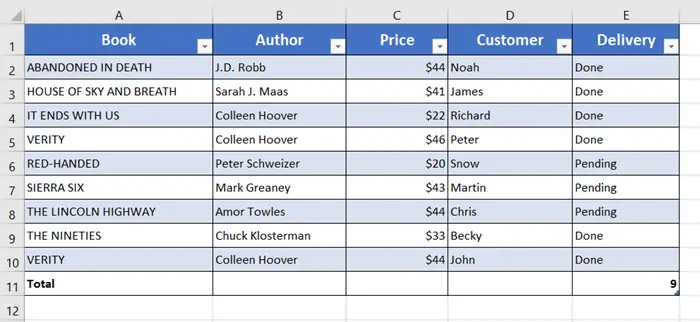
- Then from the Table Styles Options group, checkmark the box of Total Row.
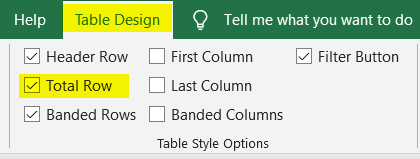
You will notice an additional row has shown up below the table with the total number of rows.
4. Sum Values
You can also sum up the values with the table. Like, I want to sum the total amount of price from the Price column.
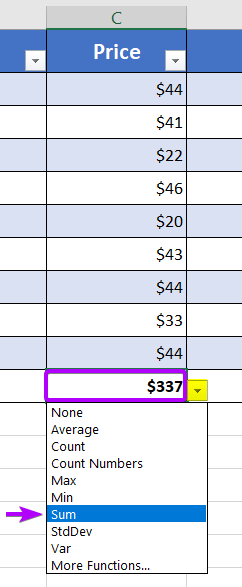
- Select the empty cell at the bottom of the Price column.
A down arrow will appear instantly. - Click on the down arrow.
- Select the Sum command.
Here the total value is $337.
Conclusion
I hope you got an overall idea about how to use a table in Microsoft Excel. It will help you to save time to organize a dataset. Try the feature next time and tell us in the comment section how you like our Blog page. Have a good day!
Excel Glossary | Autosum | Fill Handle | Conditional Formatting | Merge & Center | Wrap Text | Flash Fill | Find & Replace | Freeze Panes | Format Painter | Format Cells | Sort & Filter | Advanced Filter | Text to Columns | Go To Special | Calculation Options | Name Manager | Slicer | Power Query | Add-ins
 The Create Table window will come along on the screen. You can also press CTRL+T to open the Create Table dialog box. There you will see Excel has already selected the cell range automatically.
 You will see the table is set with a color theme. Change the color theme if you want,
 See only the Delivery Done items are shown now.
 You can also filter the table contents with the Text Filters menu.