2 Ways to Create a Stem and Leaf Plot in Excel
The Stem and Leaf plots help to note down multi-digited numbers really fast. You may need to create a Stem and Leaf lot for counting products, taking notes of the test scores, noting down lab results, etc. In this article, I will describe how you can create a Stem and Leaf plot in Excel.
What is a Stem and Leaf Plot?
A Stem and Leaf plot is a kind of data plotting system that places a large amount of data in a placement value system that will help the readers acquire the numeric report in a very short time.
The plot contains two parts: the Stem and the Leaf. The main column of the plot, called the Stem, lists all the digits in the tenth place and beyond in order. The other columns on the left side of the stem are called the Leaf.
For Example, If a dataset has two numbers: 23 and 25, the Stem will be 2, and the Leaf will be 3 and 5.
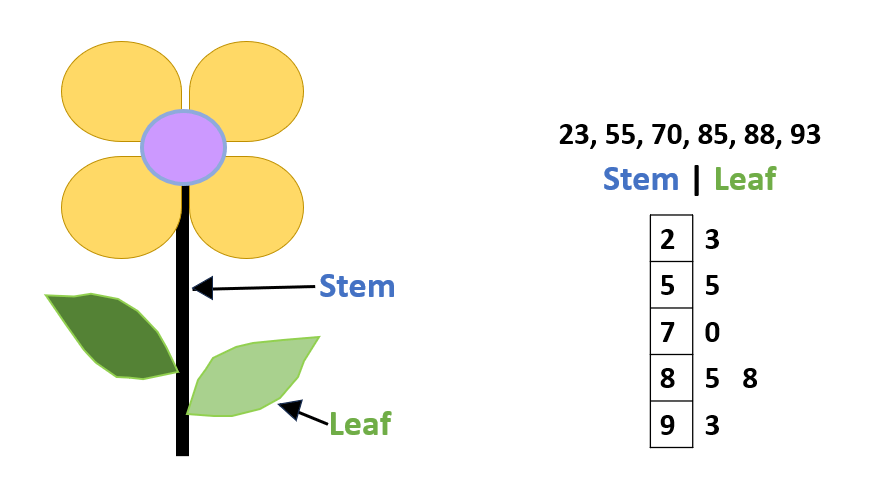
If the plot counts two categories of data, it can also have two leaves on both sides.
Introduction to the Dataset
Let’s say I harvest mangoes on a patch of land. I take note of the numbers after counting how many mangoes are on each tree. Some trees are big and have produced a lot of mangoes, and some trees have produced fewer.
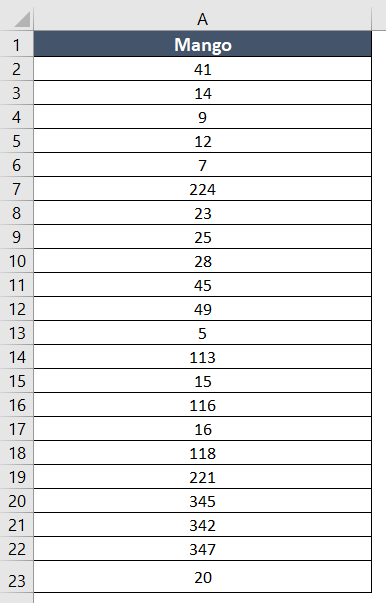
Now I will show you how I create a Stem and Leaf plot from this dataset in Excel using different methods.
Easiest Way to Create a Stem and Leaf Plot in Excel
In the first method, I will be using the FLOOR function and the RIGHT function to create the Stem and Leaf plot.
Usage Guide
Step_1: Select the data range, cell A1:A23.
Step_2: Then go to the Data tab.
Step_3: Select the Sort A to Z button from the Sort & Filter group.
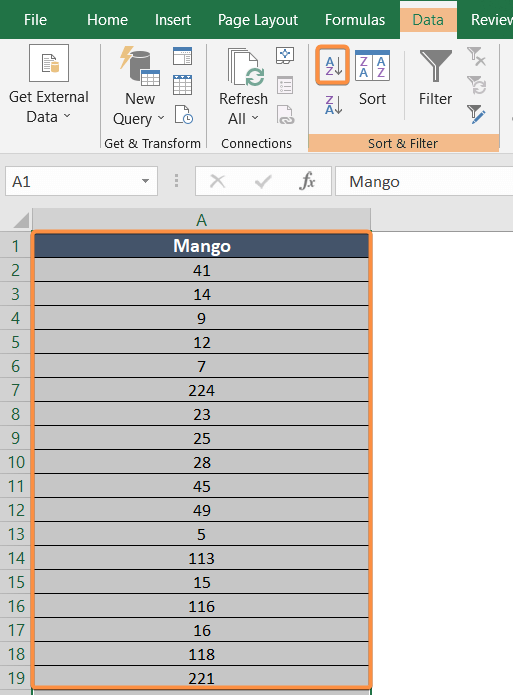
The Sort Warning window will pop up on the worksheet.
Step_4: Select Continue with the current selection box.
Step_5: Hit the Sort button.

This will reorganize the dataset from the smallest to the largest numerical order.
Step_6: Create two new columns named Stem and Leaf in columns B and C, respectively.
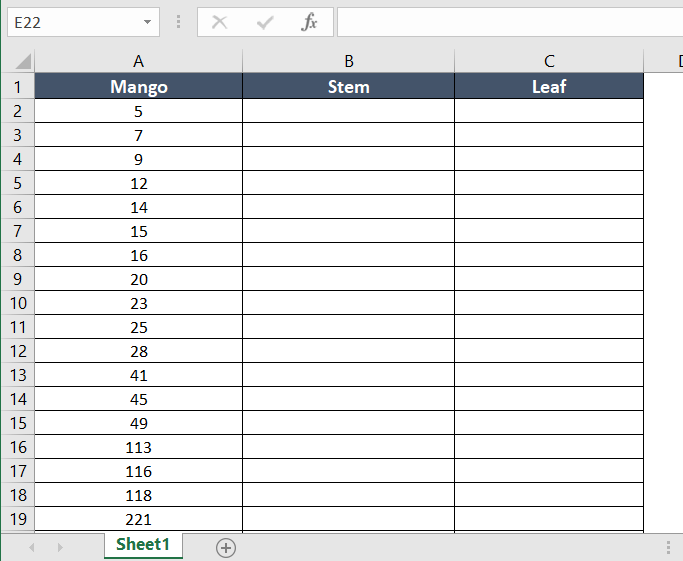
Step_7: Type this formula in cell B2:
=FLOOR.MATH(A2/10)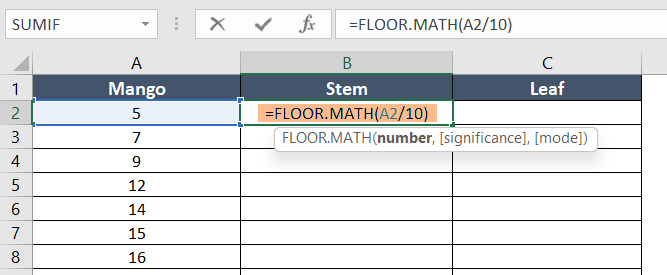
Formula Explanation
- A2 is 5.
- A2/10 is 0.5.
- FLOOR.MATH function rounds down 0.5 and returns the value 0 in cell B2.
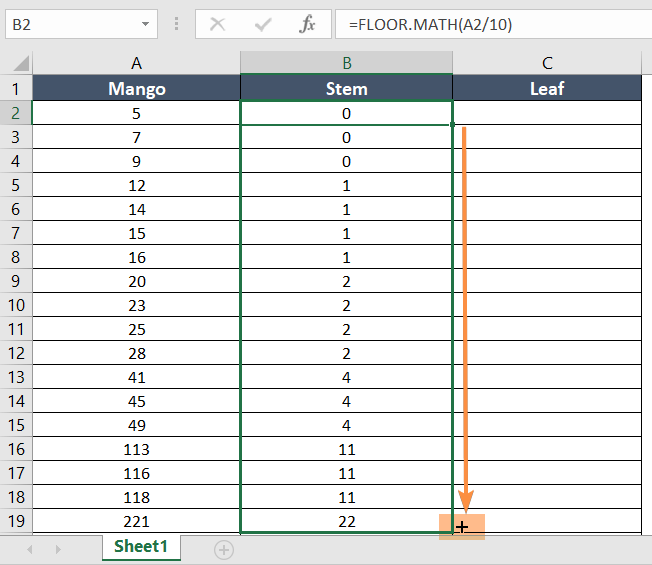
Step_8: Take the cursor on the right bottom corner of cell B2 and drag the Fill Handle from cell range B2:B23.
Step_9: Type this formula in cell C2:
=RIGHT(A2,1)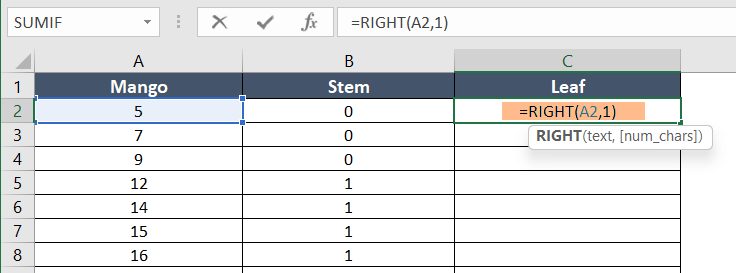
Formula Explanation
- A2 is 5.
- 1 is the mention of the number of characters.
- The RIGHT function returned 1 character from the right side of A2. As inside cell A2, there is only one character, 5, so in cell C2 the RIGHT function returned 5.
Step_10: Drag the Fill Handle icon from cell range C2:C23.
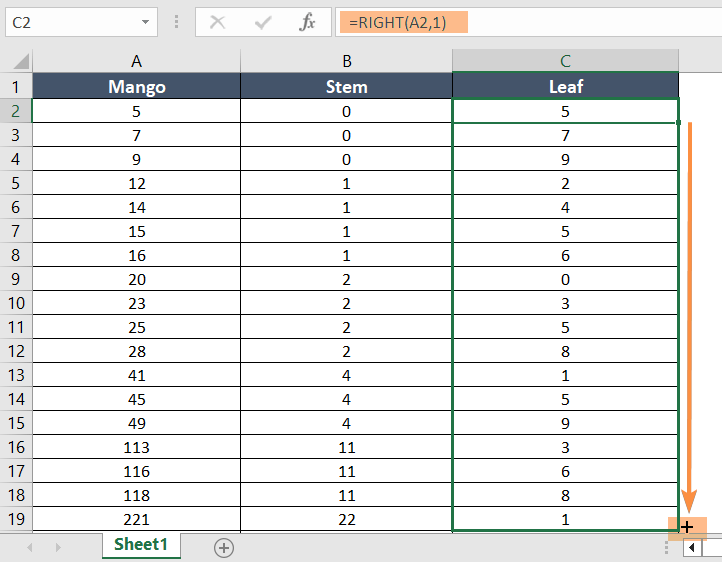
Organize the Result
The columns Stem and Leaf now display the findings. The Stem column, however, includes a repetition of numbers, which is the problem now. For example, the values in cells B2 to B4 are 0. Here, the plot would be satisfied with a single 0.
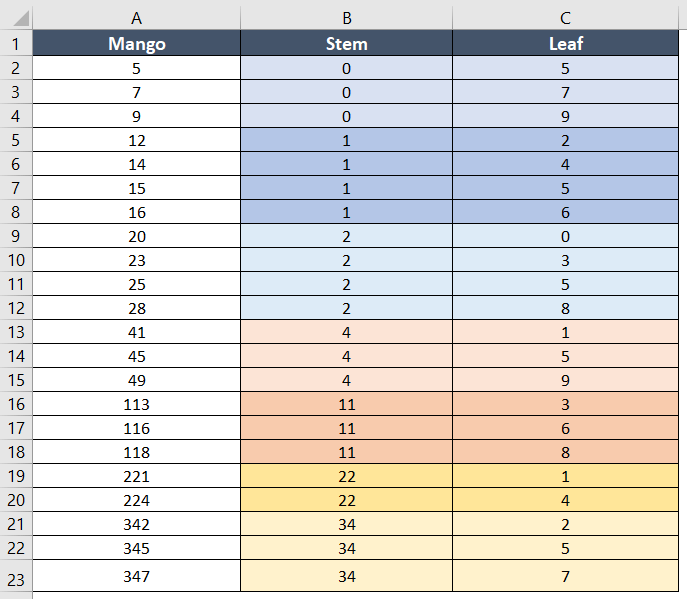
Tip: I colored those cells that have the same Stem. You can use the Fill Color command to do that.
Final Result >
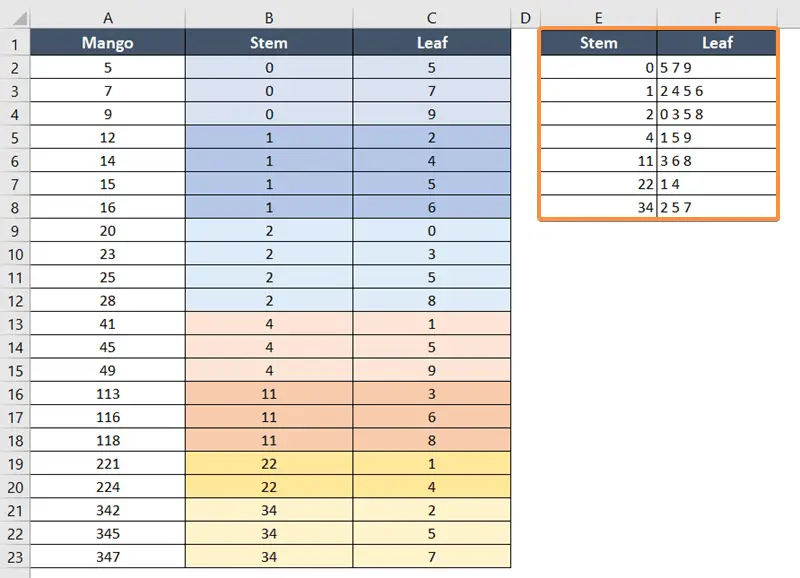
In columns E and F, I created a new dataset for the final result. As cell B2:B4 has 0, I input a single 0 in cell E2 (Stem). As the 0 in cell B2:B4 has corresponding numbers: 5 (C2), 7 (C3), and 9 (C4), I inserted 5 7 9 in cell F2 as the Leaf.
I repeated the same process for the rest of the cells, and the final result is delivered in the cell range E1:F8.
Alternative Way: Use the REPT Function to Create a Stem and Leaf Plot in Excel
The formula for this method will seem a little bit lengthy at first. Don’t worry, I will break down the formula later in the Formula Explanation part. And if you still find the formula complex, just copy it from the article.
Usage Guide
Step_1: Select the cell range A1:A23.
Step_2: Go to the Data tab.
Step_3: Now, click on the Sort A to Z button from the Sort & Filter group.

Step_4: Create a new column named Stem in an empty cell (C1).
Step_5: Type this formula in cell C2:
=FLOOR.MATH(A2/10)Step_6: Take the cursor on the right bottom corner of cell C2 and double-click on the Fill Handle icon.
The formula will be copied down from C2 to C23 automatically.
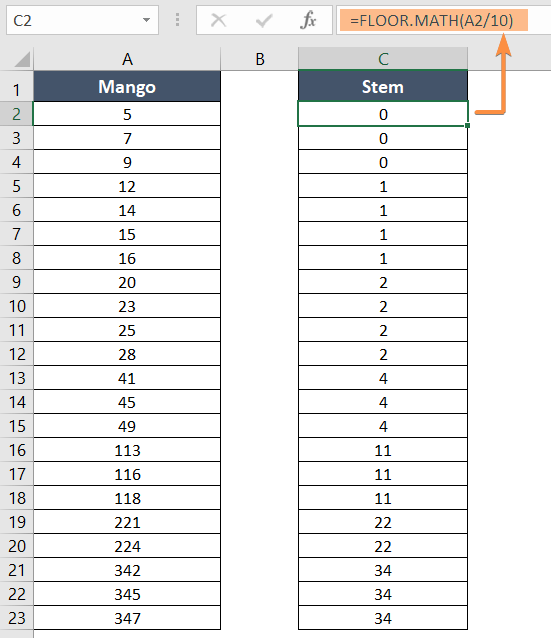
Formula Explanation
- A2 is 5.
- A2/10 is 0.5.
- FLOOR.MATH function rounds down 0.5 and returns the value 0 in cell C2.
Similarly,
- A23 is 347.
- A23/10 is 34.7.
- FLOOR.MATH function rounded down the value 34.7 and returned 34 in cell C23.
Step_7: Create a new column named Leaf in cell D1.
Step_8: Write this formula in cell D2:
=REPT("0",COUNTIF($A$2:$A$23,C2*10+0))&REPT("1",COUNTIF($A$2:$A$23,C2*10+1))&REPT("2",COUNTIF($A$2:$A$23,C2*10+2))&REPT("3",COUNTIF($A$2:$A$23,C2*10+3))&REPT("4",COUNTIF($A$2:$A$23,C2*10+4))&REPT("5",COUNTIF($A$2:$A$23,C2*10+5))&REPT("6",COUNTIF($A$2:$A$23,C2*10+6))&REPT("7",COUNTIF($A$2:$A$23,C2*10+7))&REPT("8",COUNTIF($A$2:$A$23,C2*10+8))&REPT("9",COUNTIF($A$2:$A$23,C2*10+9))
Formula Explanation
- 0 is the number I want to be repeated in the REPT function.
- COUNTIF($A$2:$A$23, C2*10+0) is the condition for 0 to be repeated.
- $A$2:$A$23 is the Absolute Cell Reference of A2:A23.
- C2*10+0 is multiplying C2 with 10 because we divided the numbers in the Stem column in FLOOR.MATH function.
In a similar manner, I used the same formula for 0–9 and added the REPT function with the & symbol.
Step_9: Double-click on the Fill Handle icon in cell D2.
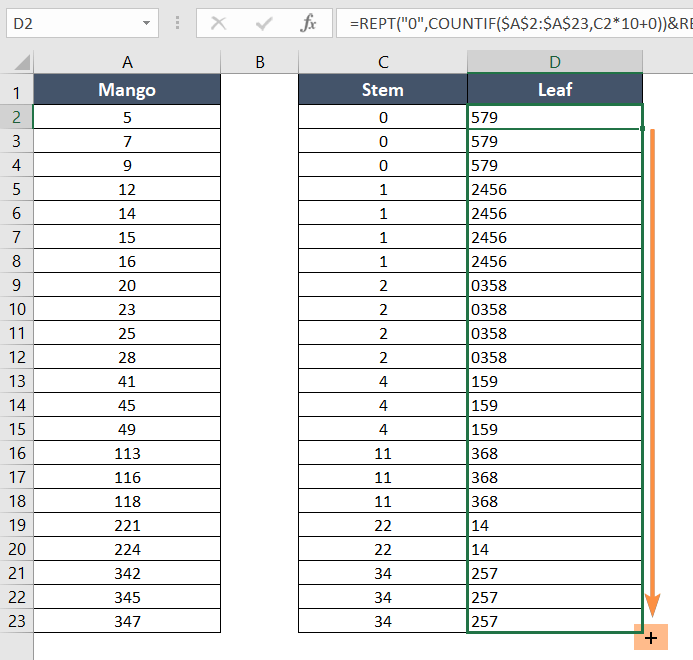
Step_10: Press the CTRL key and select the repeated cells while keeping the CTRL key pressed.
Step_11: Right-click on any of the selected cells and click on Delete.
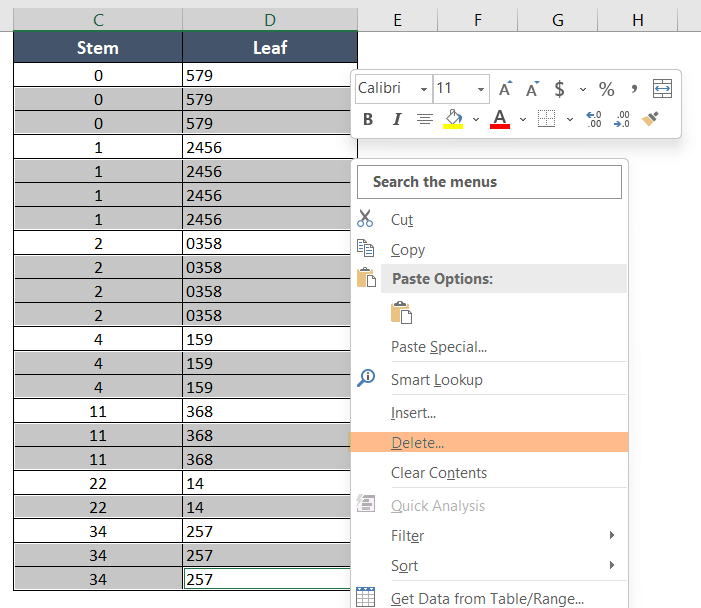
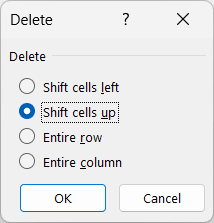
Step_12: Select Shift cells up from the Delete dialog box.
Step_13: Hit OK.
Final Result >
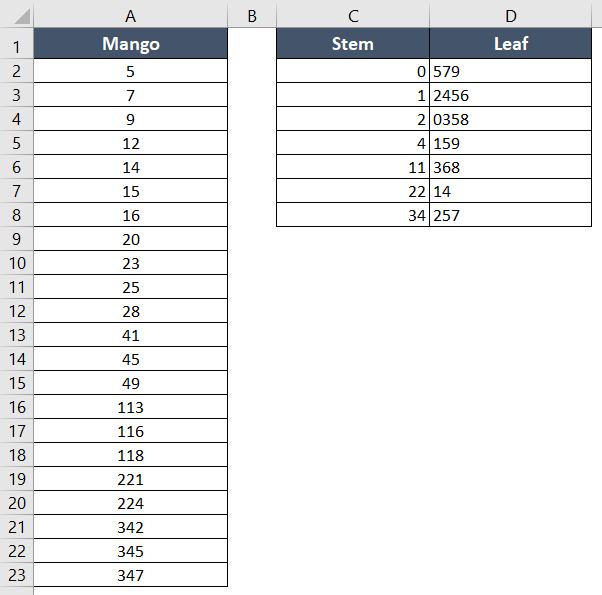
After trimming the unnecessary cells, the Stem and Leaf plot is displayed in cell range C1:D8.
When Do You Need a Stem and Leaf Plot?
- When the data set has multi-digit numbers.
- When you want to instantly note down long numbers, like test scores, temperatures, or counting products.
- It has better readability than other data representing charts like histograms or bar charts.
Tips for Using the Stem and Leaf Plot in Excel
- Always rearrange the dataset in ascending order before plotting it.
- Keep your dataset small, so data plotting will be easier for you.
- For further statistical analysis, you can find the median and mean of your dataset.
Conclusion
You can apply any of the methods in this article. I hope I delivered the complete concept of creating and using the stem and leaf plot in Microsoft Excel. Share your comments about this blog in the comment section. Also, keep visiting our site to learn more about Excel. Happy Excelling!
