Skip to content
Excelgraduate

Excelgraduate

A to Z Solution Provider

  • Home
  • Blog
  • CategoriesExpand
    • Basic Excel
    • Advanced Excel
    • Excel Functions
    • Excel Formulas
    • Pivot Table
    • Power Query
    • Visual Basic
    • Excel for Business
    • Excel Glossary
  • About
  • Contact
Excelgraduate
Excelgraduate
A to Z Solution Provider
How to Create a Correlation Graph in Excel
Charts and Graphs

How to Create a Correlation Graph in Excel

Rhidi Barma August 28, 2023 Charts and Graphs

Correlation graphs help determine the linear relationship between two types of variables. The variables are placed on a vertical and…

Read More How to Create a Correlation Graph in ExcelContinue

How to Add Trendline Equation in Excel [Easy Steps]
Charts and Graphs

How to Add Trendline Equation in Excel [Easy Steps]

Rhidi Barma August 2, 2023August 5, 2023 Charts and Graphs

The trendline equation shows how the variables are illustrated on the graph. It gives a quick and accurate approach to…
Read More How to Add Trendline Equation in Excel [Easy Steps]Continue

2 Ways to Create a Stem and Leaf Plot in Excel
Charts and Graphs

2 Ways to Create a Stem and Leaf Plot in Excel

Rhidi Barma July 4, 2023August 5, 2023 Charts and Graphs

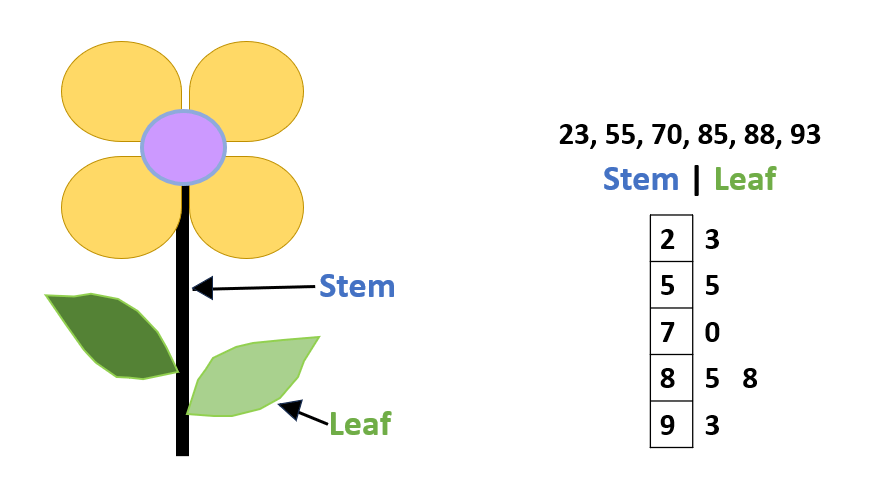
The Stem and Leaf plots help to note down multi-digited numbers really fast. You may need to create a Stem…
Read More 2 Ways to Create a Stem and Leaf Plot in ExcelContinue

2 Ways to Make Residual Plot in Excel
Charts and Graphs

2 Ways to Make Residual Plot in Excel

Rhidi Barma July 4, 2023 Charts and Graphs

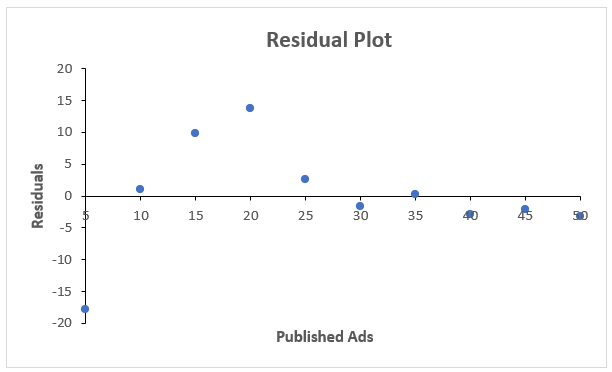
To find the non-linear values in a specified range, you may need to apply the Residual Plot to your assignments….
Read More 2 Ways to Make Residual Plot in ExcelContinue

How to Add Multiple Trendlines in Excel
Charts and Graphs

How to Add Multiple Trendlines in Excel

Rhidi Barma June 28, 2023 Charts and Graphs

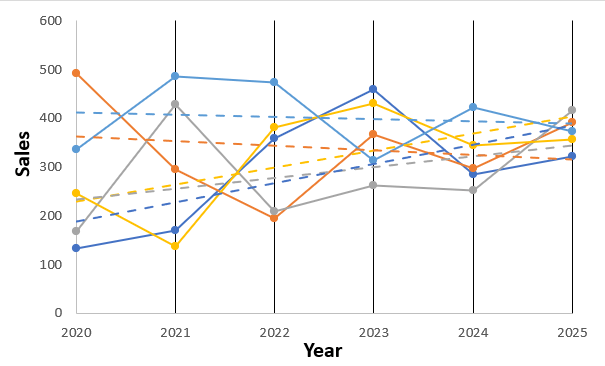
A trendline helps a chart navigate its movement over an extended timeline. Multiple trendlines are useful in various situations where…
Read More How to Add Multiple Trendlines in ExcelContinue

How to Make a Supply and Demand Graph in Excel
Charts and Graphs

How to Make a Supply and Demand Graph in Excel

Rhidi Barma June 22, 2023 Charts and Graphs

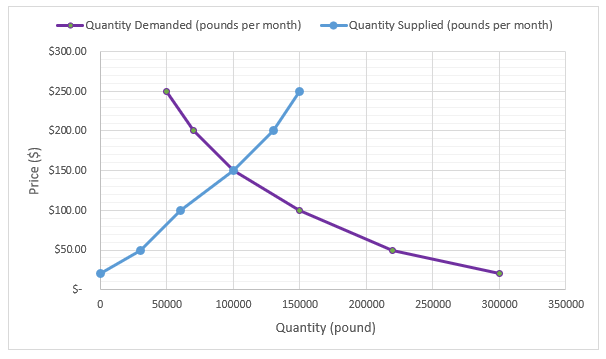
A supply and demand graph is a visual representation of the relationship between the quantity of a product or service…
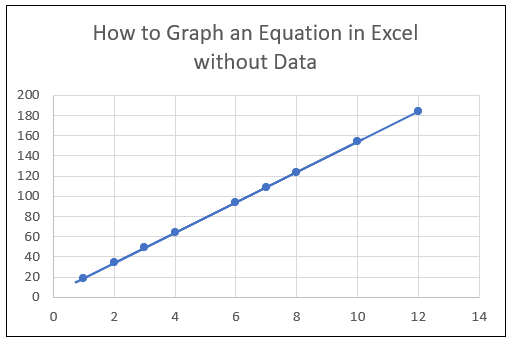
Read More How to Make a Supply and Demand Graph in ExcelContinue

How to Graph an Equation in Excel without Data (2 Cases)
Charts and Graphs

How to Graph an Equation in Excel without Data (2 Cases)

Rhidi Barma June 18, 2023June 20, 2023 Charts and Graphs

Do you know you can save a lot of time by graphing an equation in Excel without entering the dataset…
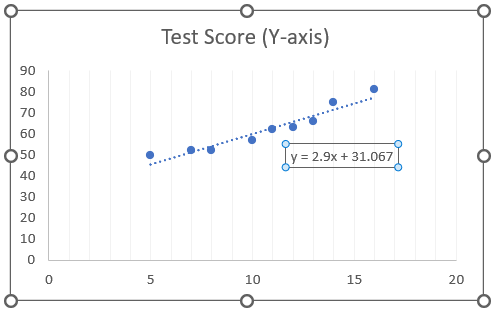
Read More How to Graph an Equation in Excel without Data (2 Cases)Continue

How to Find the Slope of a Trendline in Excel
Charts and Graphs

How to Find the Slope of a Trendline in Excel

Rhidi Barma June 14, 2023June 14, 2023 Charts and Graphs

Using graphs and charts in business is an intelligent way to represent the data visually. The slope is an element…

Read More How to Find the Slope of a Trendline in ExcelContinue

  • About
  • Blog
  • Contact

Excelgraduate

A to Z Solution Provider

DMCA.com Protection Status
  • Disclaimer
  • Privacy Policy
  • Terms & Conditions
YouTube YouTubeFacebook FacebookTwitter TwitterLinkedin LinkedinPinterest Pinterest

Copyright © 2023 Excelgraduate | All Rights Reserved.

Scroll to top
  • Home
  • Blog
  • Categories
    • Basic Excel
    • Advanced Excel
    • Excel Functions
    • Excel Formulas
    • Pivot Table
    • Power Query
    • Visual Basic
    • Excel for Business
    • Excel Glossary
  • About
  • Contact
Purchase
Search