How to Make a Supply and Demand Graph in Excel
A supply and demand graph is a visual representation of the relationship between the quantity of a product or service that suppliers are willing to offer and the quantity that consumers are willing to purchase at various price levels. In this article, I will guide you through the step-by-step process of making a supply and demand graph in Excel.
Law of Supply and Demand
The Law of Supply and Demand is a fundamental economic principle that describes the relationship between the availability of a good or service (supply) and the desire or need for that good or service (demand). It states that the price of a product or service in a competitive market will be determined by the interaction of its supply and demand.
Introduction to the Dataset
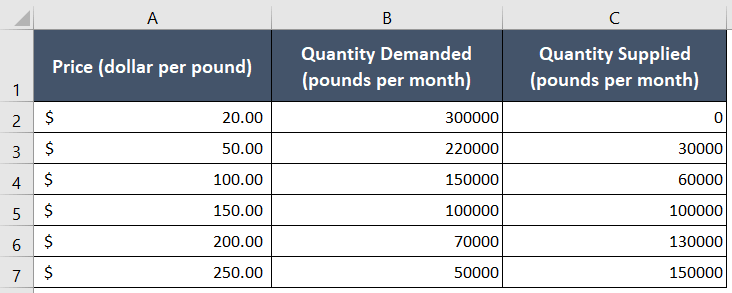
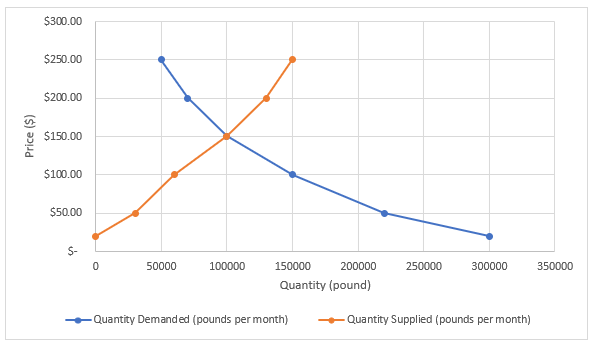
I demonstrated the patterns of supply and demand for a certain service in the market in this dataset. Since there was a surplus of supply compared to demand, notice how the price increased gradually.
Creating a Supply and Demand Graph in Excel
To create a supply and demand graph, follow my guided procedure.
Usage Guide
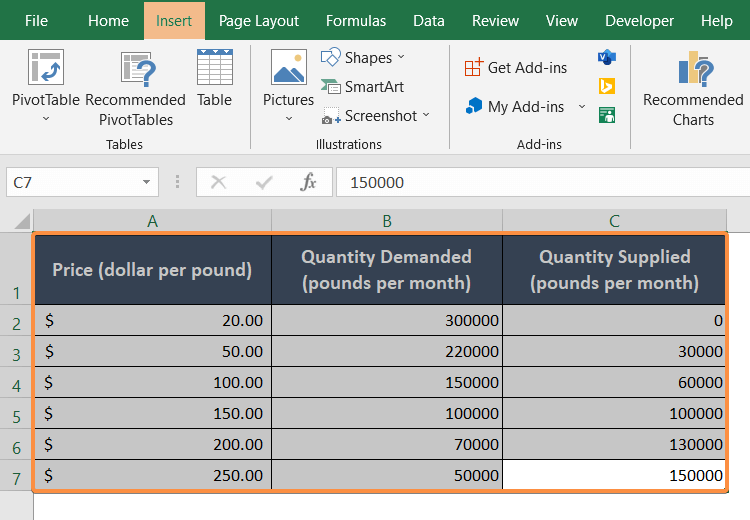
Step_1: First, select the entire data table, cell range A1:C7.
Step_2: Now go to the Insert tab.
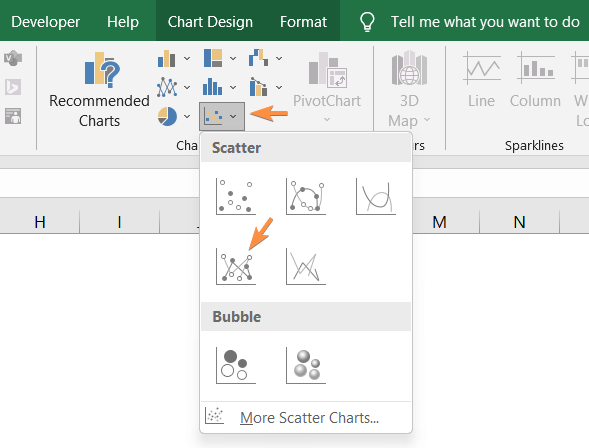
Step_3: Next, from the Charts group, click on the Scatter drop-down menu and select a plot.
I chose the Scatter with Markers and Straight Lines as my preferred option.
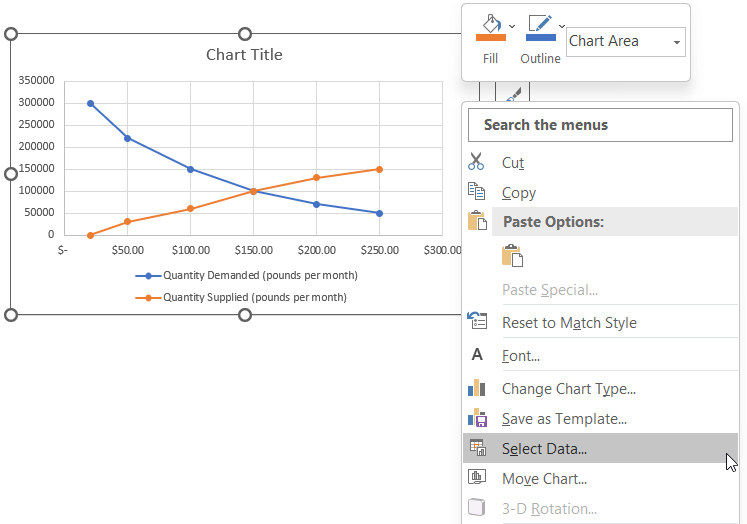
As the Scatter Chart appears on the worksheet, you will notice the supply and demand scatter lines are present. But the price values are located on the X-axis of the graph. The common placement of the price is on the Y-axis in the traditional way.
For this reason, I will alter the positions of the X and Y-axis now.
Step_4: Right-click on the chart.
The context menu will pop up.
Step_5: Click on Select Data.
The Select Data Sources dialog box will come along above the chart.
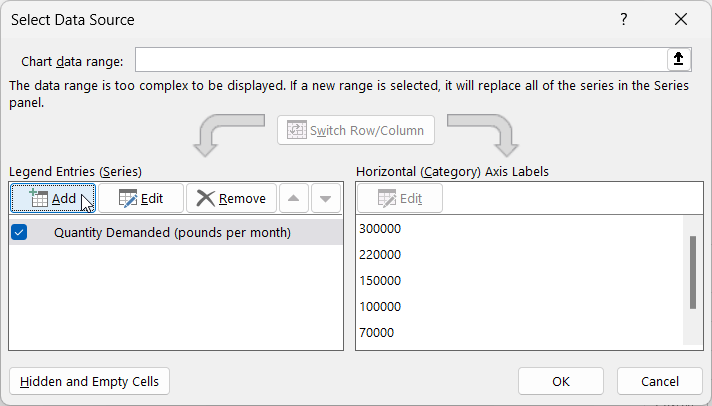
Step_6: Click on the Remove button twice to remove both inputs from the Legend Entries (Series).
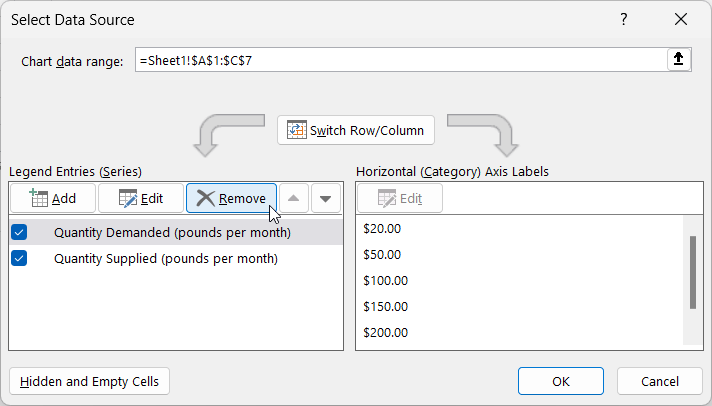
The field will be clear and look like the image below:
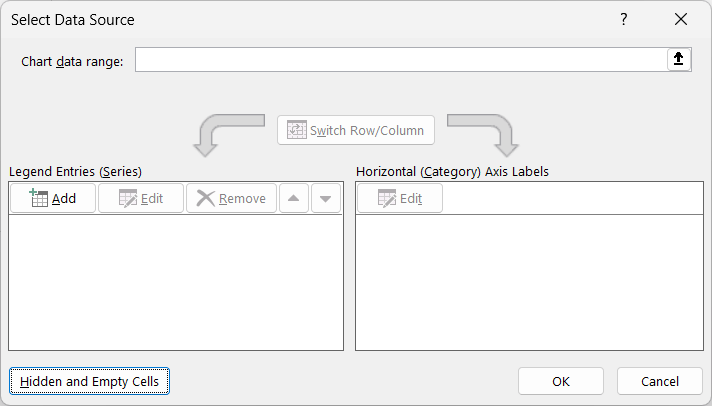
Step_7: Now select the Add button.
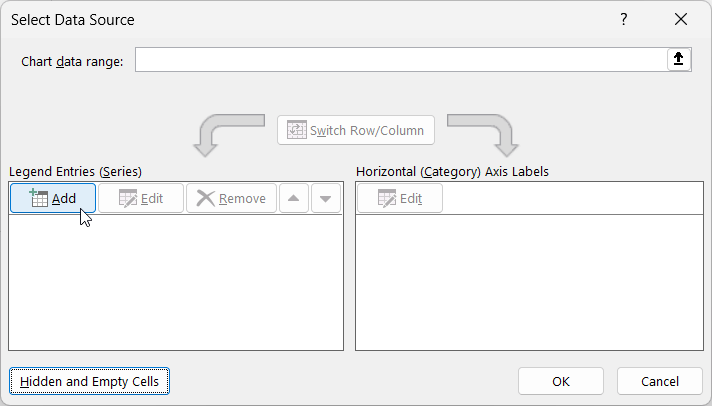
The Edit Series dialog box will show up on the Excel sheet.
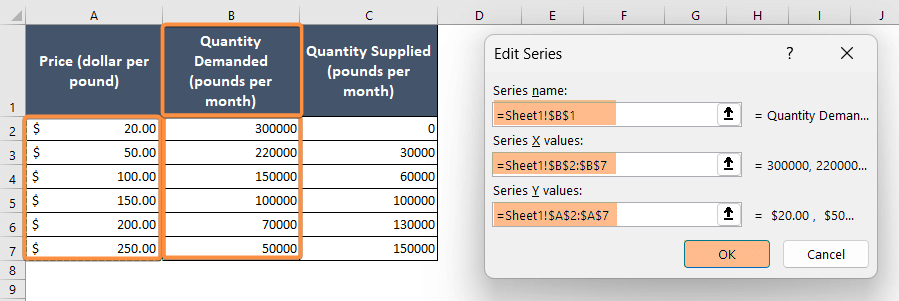
Step_8: In the Series Name box, select cell B1. The cell address of B1 will instantly appear in the Series Name box.
Step_9: Similarly, in the Series X box, select the cell range B2:B7 (Demand).
Step_10: In the Series Y box, enter the cell range A2:A7 (Price).
Step_11: Now hit OK.
Now I will add the graph of Supply.
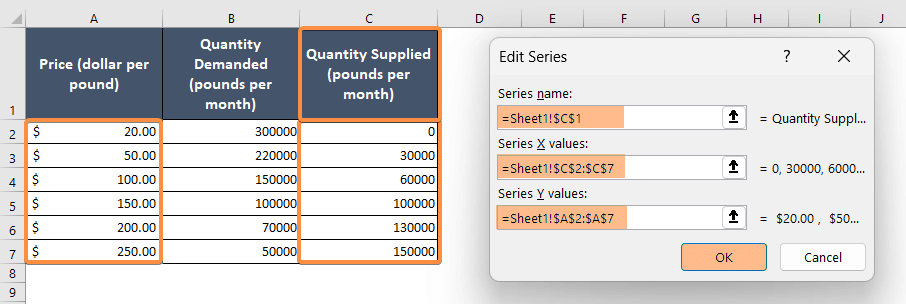
Step_12: Again click on the Add button.
Step_13: In the Edit Series dialog box, enter the Series Name box, cell C1.
Step_14: In the Series X box, select the cell range C2:C7 (Supply).
Step_15: In the Series Y box, enter the cell range A2:A7 (Price).
Step_16: Click on the OK button.
Final Result >
Now the Supply-Demand graph is completely ready and looks like the one I have below:
Why We Make a Supply and Demand Graph
- Helps determine the price and quantity at which demand equals supply.
- Shows how changes in supply and demand affect prices.
- Visualizes shifts in supply and demand curves due to factors like technology, preferences, or policies.
- Identifies imbalances and guides decisions for optimal resource allocation.
- Assists policymakers in evaluating the impact of interventions on market outcomes.
- Enables predictions about future market conditions based on shifts in the curves.
Conclusion
I hope now you have a complete idea about how to use a supply and demand graph in Excel and why it is essential to plot various business matters. Visit our website to learn more about the different uses of Microsoft Excel. Also, feel free to comment in the comment box if you have any questions regarding this topic. Thank you!