How to Add Trendline Equation in Excel [Easy Steps]
The trendline equation shows how the variables are illustrated on the graph. It gives a quick and accurate approach to measuring the relationship between the variables. There are several types of trendlines. Excel has every one of them. In this article, I will explain to you how to add the trendline equations in Excel. Let’s begin!
Introduction to the Dataset
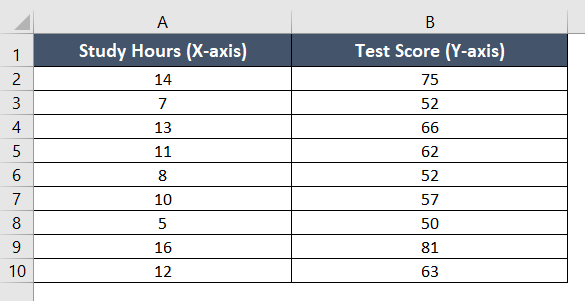
In this dataset, the column Study Hours showed the hours I spent studying, along with the test results in the column Test Score.
Easiest Way to Add Trendline Equation in Excel
The dataset represents the linear change of the variables. I will show you the method of adding the linear trendline and its equation.
Usage Guide
Step_1: First, select the cell range A1:B10.
Step_2: Now go to the Insert tab.
Step_3: Next, select the Scatter plot from the Charts group.
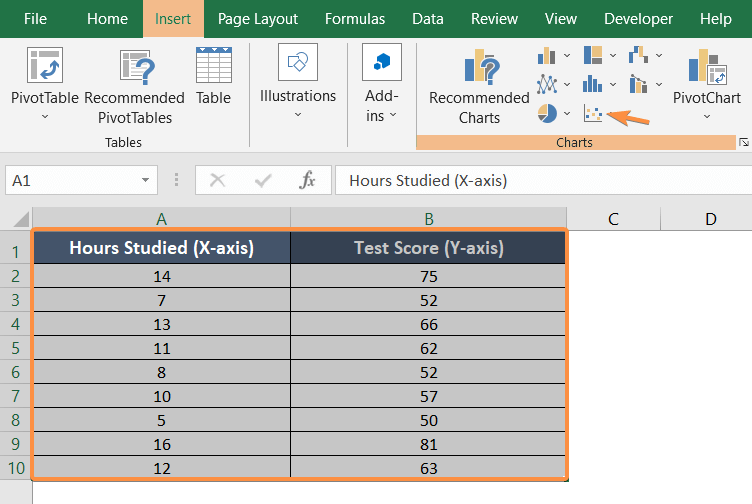
I chose the first option from the Scatter plot drop-down menu.

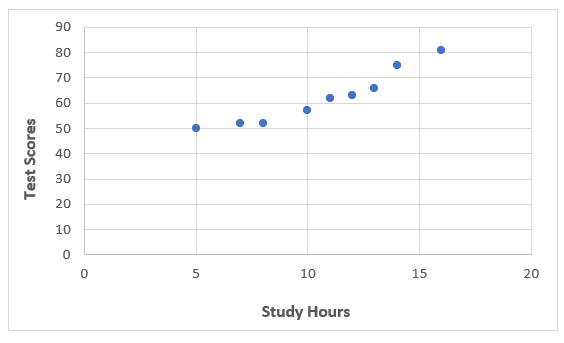
The scatter chart will appear on the worksheet like the graph below:
Step_4: Then click on the plus (+) sign beside the scatter chart to open the Chart Element.
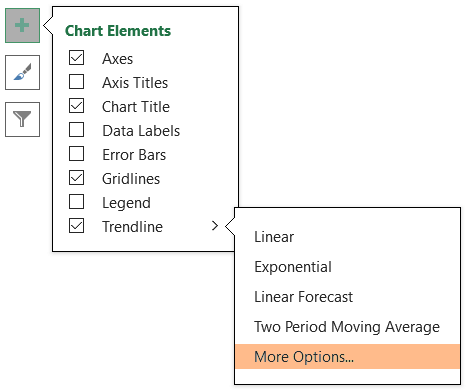
Step_5: From the drop-down menu, select Trendline>Linear.
The trendline will appear above the chart instantly.
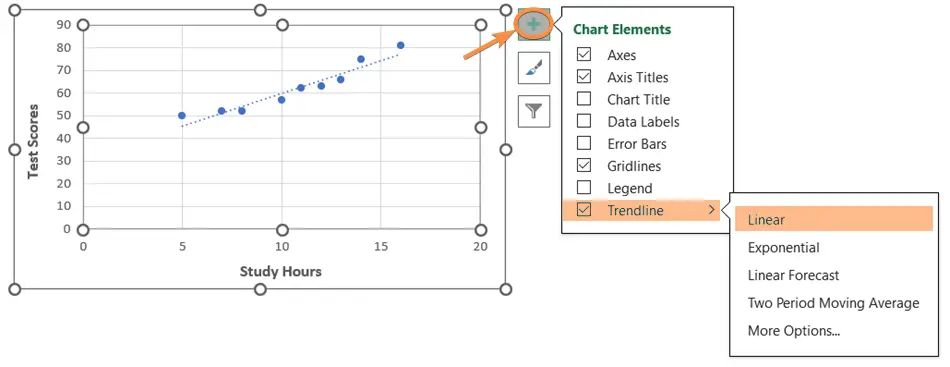
Step_6: Then click on the More Options from the menu.
The Format Trendline tab will appear on the right side of the screen.
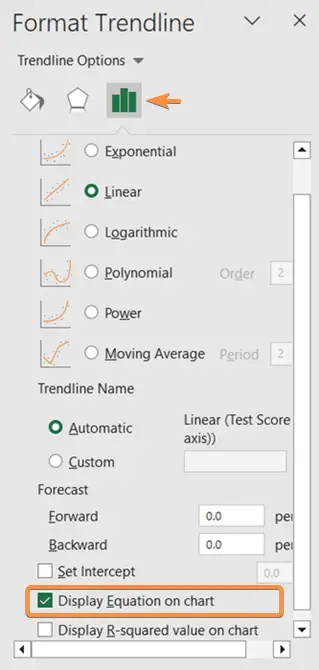
Step_7: Click on the Display Equation on Chart check box.
Final Result >
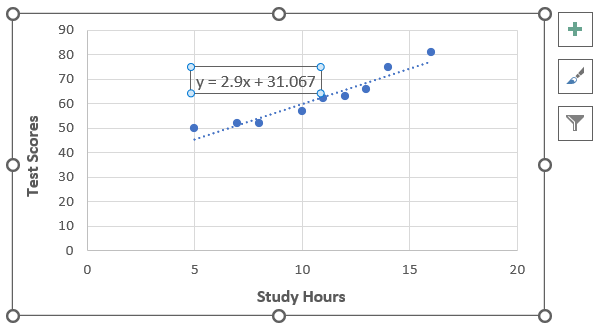
The equation will take place beside the trendline.
The equation here is y = 2.9x + 31.067. According to the equation of a straight line (y = mx + c), the value of the slope is 2.9.
Types of Trendline Equations in Excel
Once you know the technique to add the trendline equation in Excel, you now have to get familiar with all types of trendlines. It is important because, without recognizing the pattern of a chart, it will be difficult to add the appropriate trendline equation to the graph.
1. Linear Trendline Equation
A linear trendline is appropriate when the data shows a relatively constant rate of change between the variables. The data points will be in linear ascending or descending order.
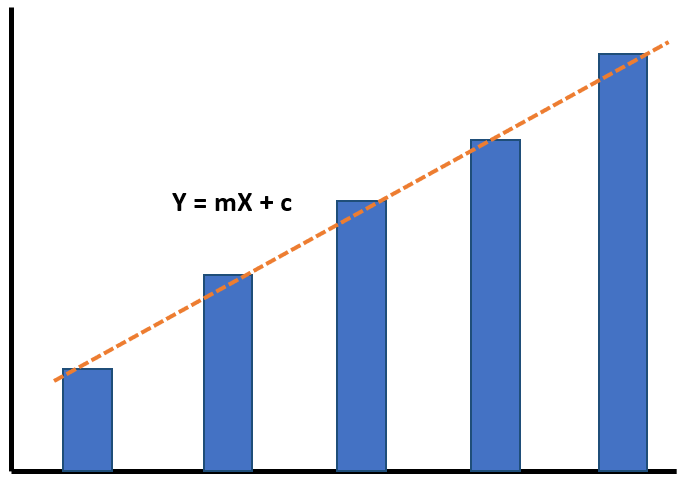
- Y: Dependent variable.
- X: Independent variable.
- m: Slope of the line. It represents the rate of change in the dependent variable for a unit change in the independent variable.
- c: Y-intercept, which represents the value of the dependent variable when the independent variable is equal to zero.
2. Exponential Trendline Equation
An exponential trendline is used when the data shows a rapid growth or decay pattern.
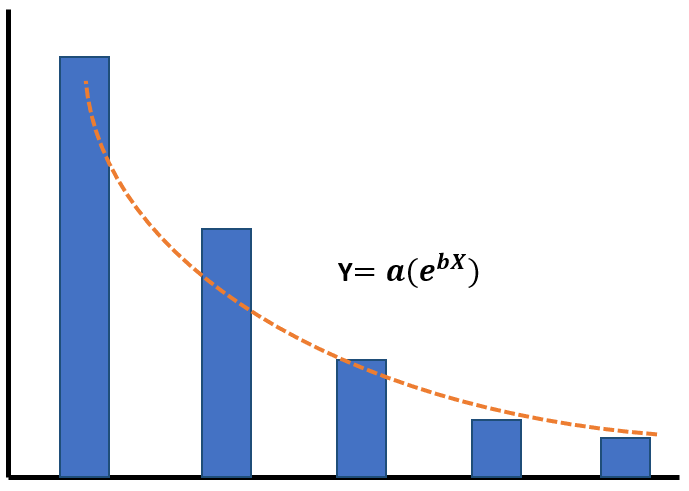
- Y: Dependent variable.
- X: Independent variable.
- a: Coefficient.
- exp(): Exponential function, which raises the base
- b: Exponent, which determines the rate of growth or decay.
3. Logarithmic Trendline Equation
Logarithmic trendlines show a fast growth or drop pattern. The equation of logarithmic trendline can contain both positive and negative values.
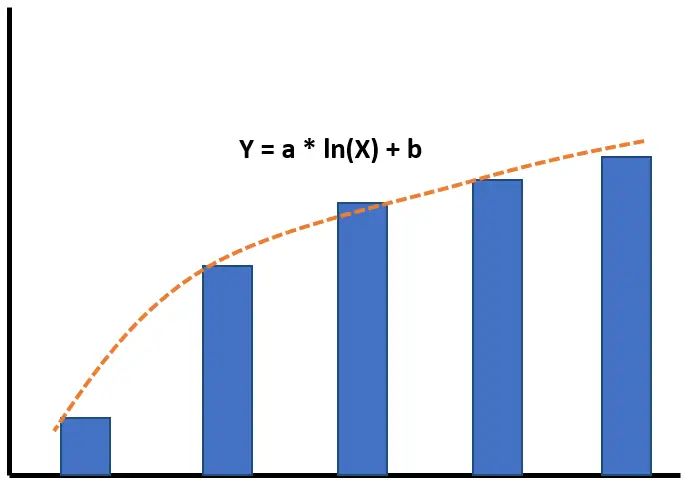
- Y: Dependent variable.
- X: Independent variable.
- a: Coefficient, which determines the steepness of the curve.
- ln(): Logarithm function, which calculates the logarithm of X to the base e.
- b: Y-intercept.
4. Polynomial Trendline Equation
Polynomial trendlines can capture various patterns, including curves, peaks, and valleys in the data. It is used when the data points exhibit a more complex relationship, that cannot be adequately represented by a simple straight line or other types of trendlines.
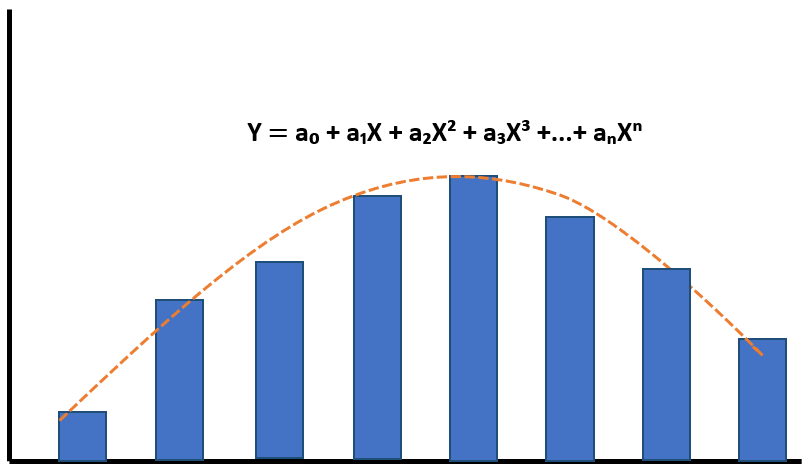
- Y: Dependent variable.
- X: Independent variable.
- a₀, a₁, a₂, …, aₙ: Coefficient, represent the slopes of the different powers of X in the polynomial equation.
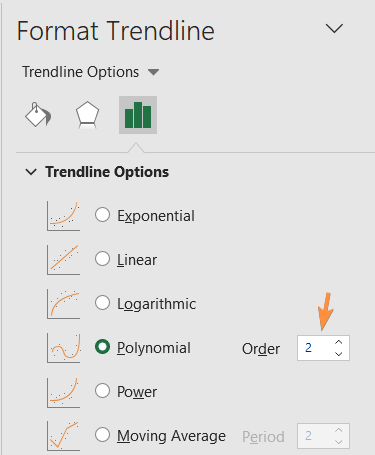
When you add a polynomial trendline to an Excel chart, the default degree is 2, and you can change it by entering the desired number in the Order box on the Format Trendline pane.
5. Power Trendline Equation
When one variable’s rate of change is proportional to the power of the other variable, it becomes the power trendline. The graph of the power trendline looks almost like the exponential trendline, but the power trendline has a more symmetrical curve.

- Y: Dependent variable.
- X: Independent variable.
- a: Coefficient.
- b: Exponent, indicating the power to which the X-values are raised.
6. Moving Average Trendline Equation
The moving average trendline is used when the chart has a lot of inclines and declines in its data points.
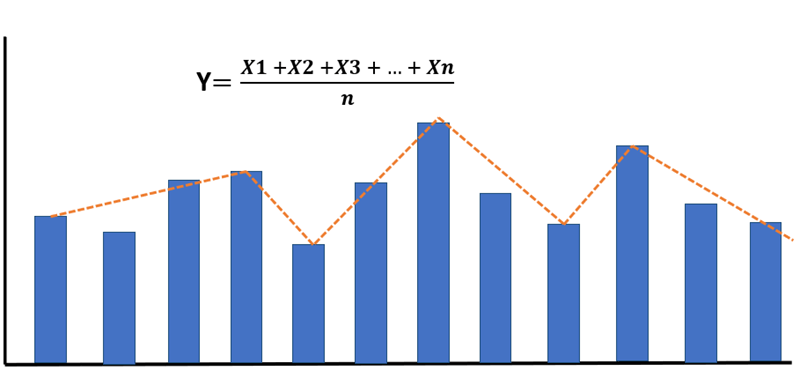
- Y: Dependent variable.
- X: Independent variable.
- n: Total number of X-variables.
Conclusion
You can easily add the trendline equation to Excel worksheets after learning the step-by-step method and the varieties of trendline equations. I hope you find this article helpful. Please let us know if you find anything confusing or have feedback about the article. Have a good day!