How to Find Q1 and Q3 in Excel
To calculate the Interquartile Range, you have to first find the first quartile (Q1) and third quartile (Q3) values. If you divide a dataset into four parts, Q3 is the 75 percentile of the dataset, and Q1 is the 25 percentile of the dataset. Luckily, Excel has some ready-to-use quartile functions that you can use to find Q1 and Q3 from any worksheet. Let’s move on to the detailed process!
In the following dataset, there are two columns, Company Name, and Stock Price.
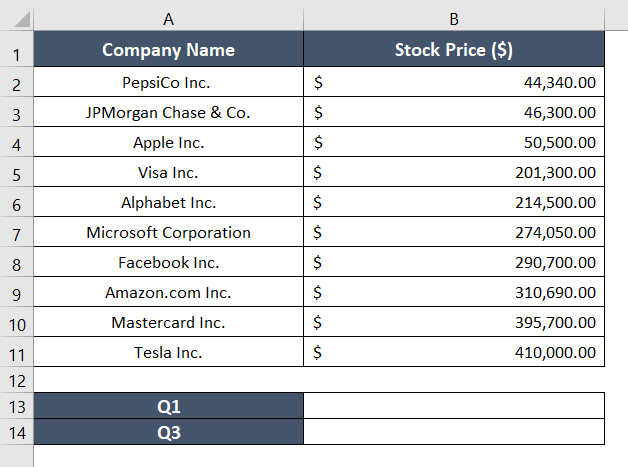
The stock prices of each brand are different and are arranged in an arbitrary order. I created a separate table for calculating Q1 and Q3. Now, I am going to calculate Q3 in cell B13 and Q1 in cell B14.
Find Q1 and Q3 in Excel Using QUARTILE Function
The easiest way to find the values of Q1 and Q3 is to use the QUARTILE function.
Find Q1
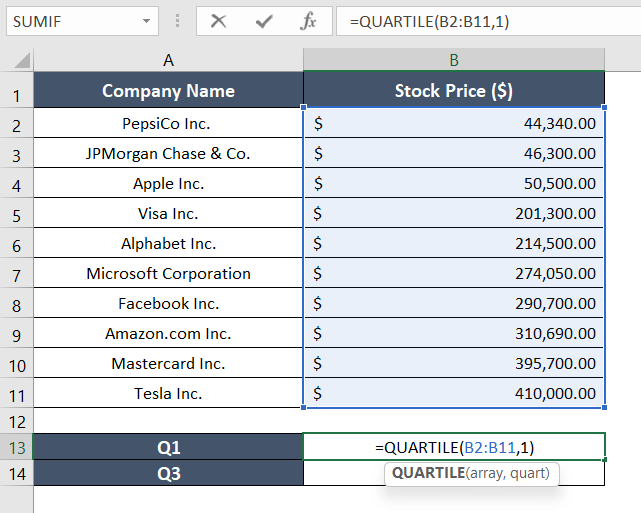
The formula to find Q1 is:
=QUARTILE(B2:B11,1)Here,
- B2:B11 is the selected array or data range. It is a compulsory argument.
- 1 is the 1st quartile, which is the 25 percentile. It is also compulsory.
To find Q1 with the QUARTILE function, follow these steps:
- Take an empty cell, B13.
- Now, type the following formula: =QUARTILE(B2:B11,1)

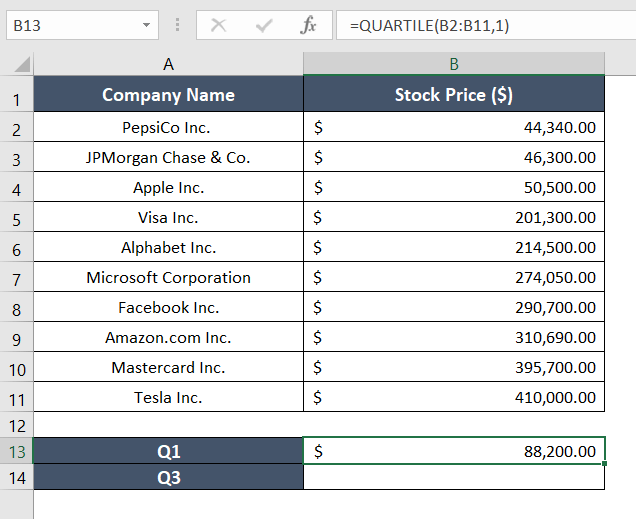
- Press ENTER to see the result.
As shown in the figure below, cell B13 has the value for Q1 for the array B2 to B11:
Find Q3
Here is the formula below to find Q3:
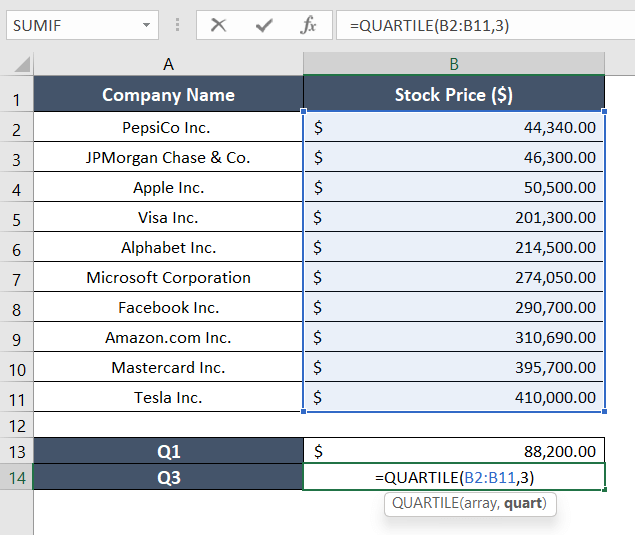
=QUARTILE(B2:B11,3)
Here is the formula breakdown:
- B2:B11 is the selected cell range.
- 3 is the 3rd quartile, which is the 75 percentile.
To find Q3 with the QUARTILE function, follow these steps:
- Take an empty cell, B14.
- Now type the following formula: =QUARTILE(B2:B11,3)

- Press the ENTER key.
The value of Q3 is in cell B14.
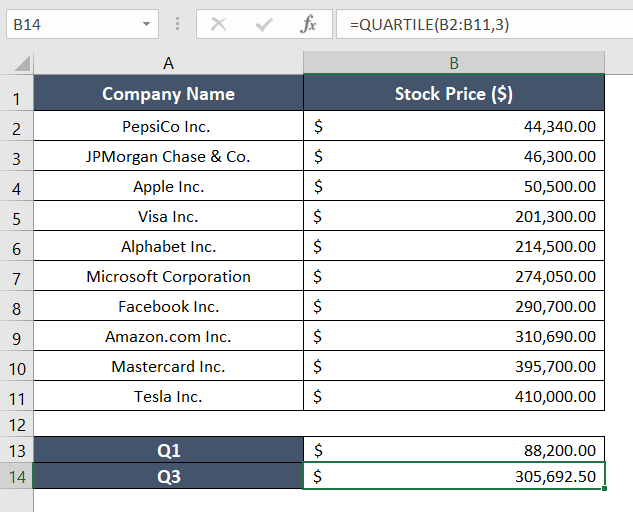
To Find the Interquartile Range in Excel, you have to calculate the difference between Q3 and Q1.
Let’s say, I want the Interquartile Range for this dataset. In that case, the formula for finding the Interquartile Range is: =B14-B13
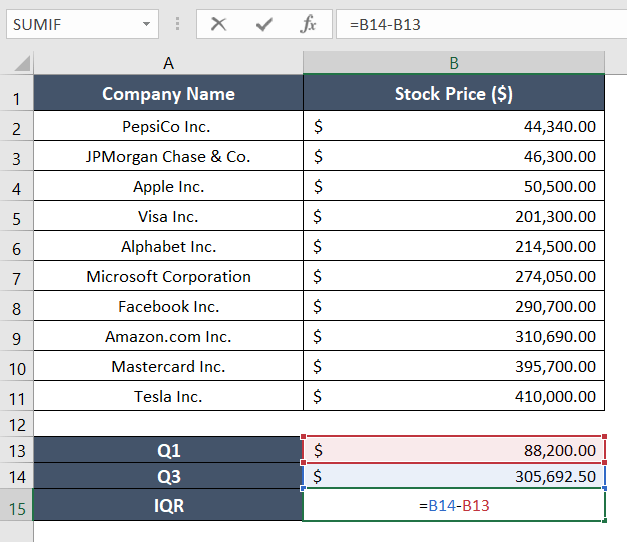
Otherwise, you can directly calculate the Interquartile Range with this formula: =QUARTILE(B2:B11,3)-QUARTILE(B2:B11,1)
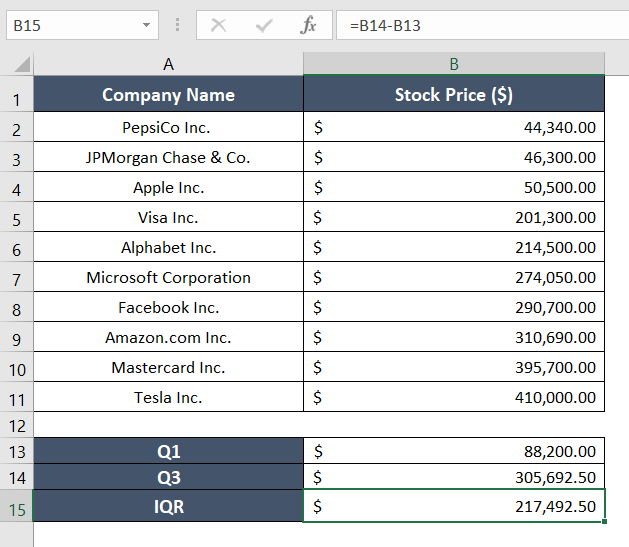
Either of the formulas will deliver the same result. For my dataset, the result is $217,492.50.
Conclusion
I hope you got an overall idea about finding Q1, and Q3, and how to find the Interquartile Range in Excel. If you’d like to know more about using Excel, visit our blog page anytime! Also, if you find something confusing about this topic, feel free to leave a comment in the comment section. Thank you!
Frequently Asked Questions
How to do Q1 and Q3 on Excel?
To find the values of Q1 and Q3, use the QUARTILE function. Suppose my array is A1:A50. Now to calculate Q1, use the formula = QUARTILE (A1:A50,1) in an empty cell. Next, to calculate Q3, type the formula = QUARTILE (A1:A50,3) in another empty cell.
How do you find the Interquartile Range (IQR)?
Subtract the 3rd quartile from the 1st quartile to calculate the IQR. The basic formula to find the IQR in Excel is = QUARTILE(array,3) – QUARTILE(array,1).
Should I use QUARTILE INC or QUARTILE EXC in Excel?
If your data set contains the entire population and you want to include the minimum and maximum values in your quartile calculation, you should use QUARTILE.INC function. However, if your data set is a sample and you want to exclude the minimum and maximum values, you should use QUARTILE.EXC function.
Are Q2 and IQR the same?
Q2 and IQR are not the same. Using the median as a substitute for the IQR can be misleading and inaccurate. The median only represents the middle value, whereas the IQR considers the lower and upper quartiles.
