2 Ways to Calculate Cumulative Frequency in Excel
Cumulative frequency is a useful statistical measure in the business sector for various reasons. By calculating cumulative frequency, you can see how many observations fall within a given range of values. This information can be helpful for various tasks, like finding outliers, comparing datasets, and predicting future trends based on previous trends. Apparently, finding the cumulative frequency value may seem intricate, but Excel makes it fast and easy. In this article, I will show you 2 ways how you can calculate cumulative frequency in Excel.
What is Cumulative Frequency?
Cumulative frequency is a statistical term that refers to the total number of times a value or a range of values occur up to a certain point in a frequency distribution, including all values that come before it. In other words, it is the running total of the frequencies of all the values up to a certain point in a frequency distribution.
For example, if we have a data set with values of 3, 5, 7, 8, and 10, and their corresponding frequencies are 2, 3, 1, 4, and 2, then the cumulative frequency of the value 8 would be the sum of the frequencies of all the values that come before it, which is 2 + 3 + 1 + 4 = 10.
Cumulative Frequency Formula
The formula for cumulative frequency:
Cumulative Frequency = Sum of all frequencies up to and including the current frequency
This can be expressed mathematically as:
CF(i) = ∑f(j), where j = 1 to i
here
- CF(i) is the cumulative frequency for the i-th observation.
- f(j) is the frequency of the j-th observation.
- the summation (∑) is taken over all observations up to and including the i-th observation.
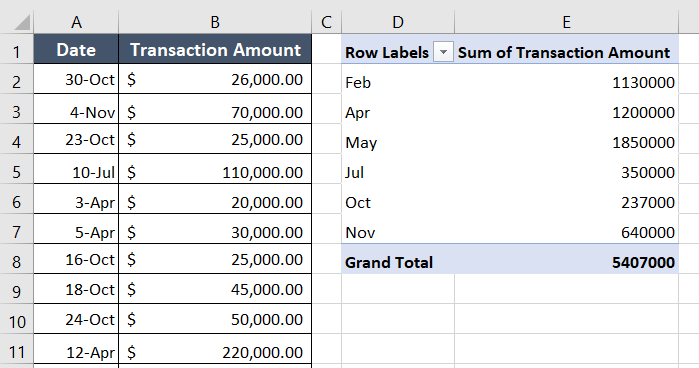
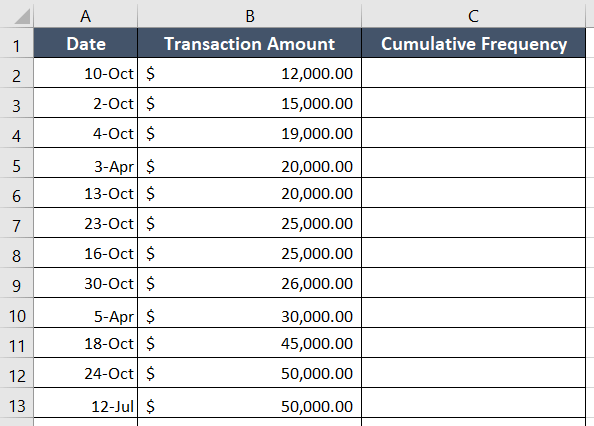
In this dataset, I have a long list of transactions from the last year of my company. Both the regularity of transactions and the volume of transactions varied from month to month. Here, just a small portion of the transactions are shown in the visual below.
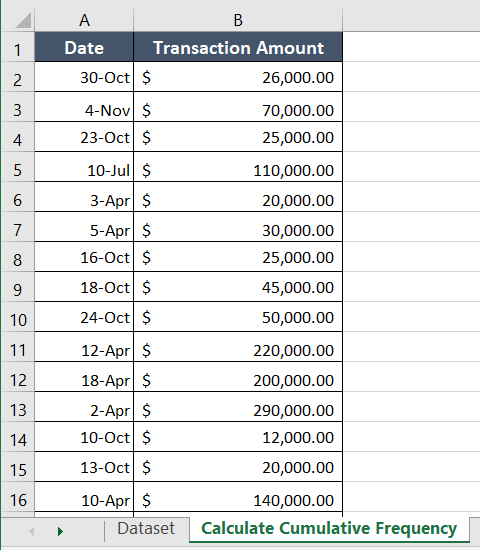
Now, let me show you how I calculate cumulative frequency in Excel.
Calculate Cumulative Frequency in Excel Inserting Pivot Table
Calculating the cumulative frequency will help me determine the amount of transacted money by the end of November. I will be using the Pivot Table to measure the cumulative frequency. The Running Total In is a great feature of the pivot table that works fine to calculate the cumulative frequency. Also, using the Running Total In feature is quicker than using the formula for cumulative frequency.
To calculate cumulative frequency in Excel with Pivot Table.
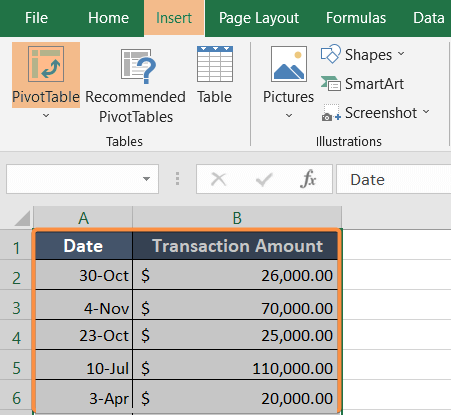
- First, select the cell range A1:B43.
- Now, go to the Insert tab.
- Select PivotTable from the Tables group.
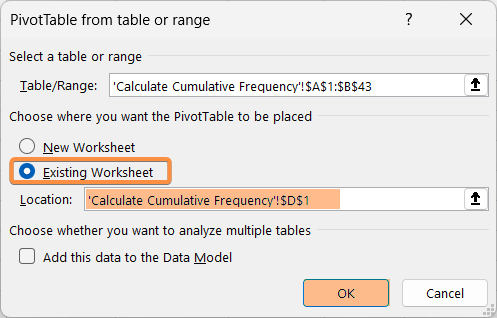
 The PivotTable dialog box will pop up on the Excel sheet.
 - Now select Existing Worksheet.
If you want the pivot table on a separate sheet, select New Sheet. - Click on cell D1 in the existing sheet as the Location.
- After that, hit OK.
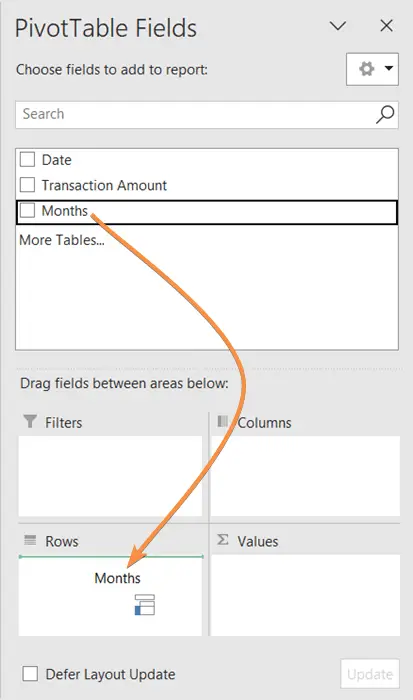
 This will bring up the PivotTable Field Task Pane on the right side of the worksheet.
 - Now drag Months from the PivotTable Field List and drop it inside the Rows area.

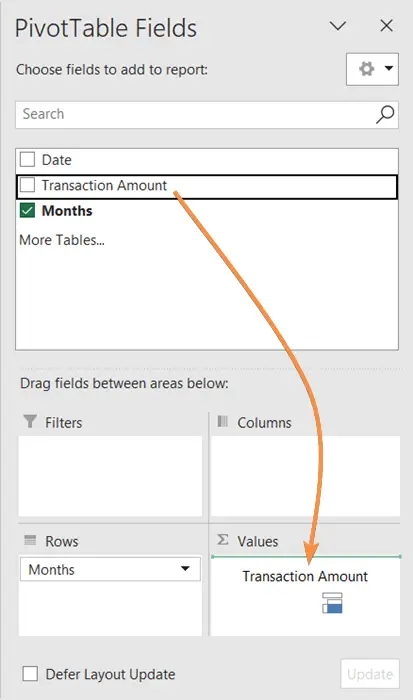
- Now select Transaction Amount from the Field List and drag it to the Values area.
 You will see a table formed in your worksheet like the one below.
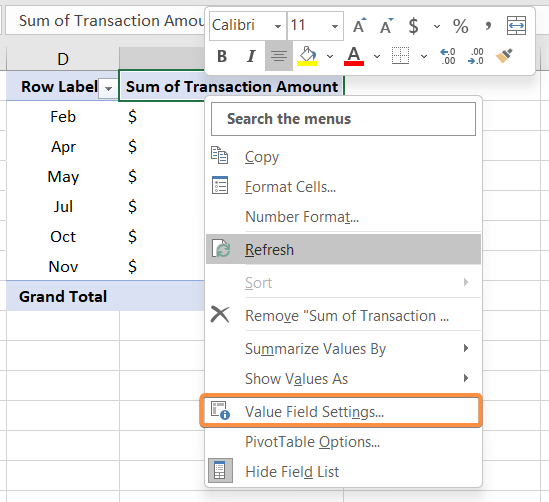
Note: In the raw dataset, the months were randomly arranged. The months were automatically adjusted once I applied the pivot table, going from earlier months to later months of the year. But if you are dealing with numerical data rather than months, it would be better to arrange the data in ascending order. To do that, use the Sort A to Z feature from the Data tab. - Now, right-click on the Sum of Transaction Amount header.

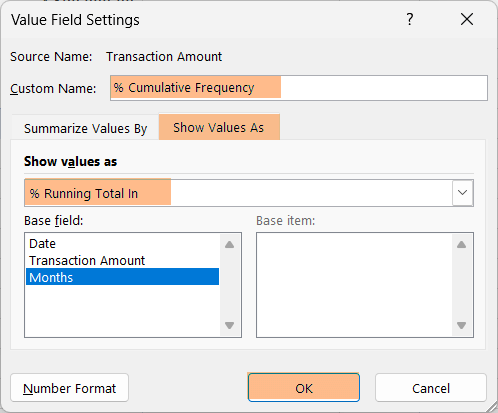
- Then, hit the command Value Field Settings.
 The Value Field Settings will show up instantly.
 - In the Custom Name box, enter a name for the column.
I entered Cumulative Frequency as the column header as I will be calculating cumulative frequency. - After that, select the tab Show Values As and click on Running Total In from the Show Values As drop-down menu.
- Finally, hit the OK button.
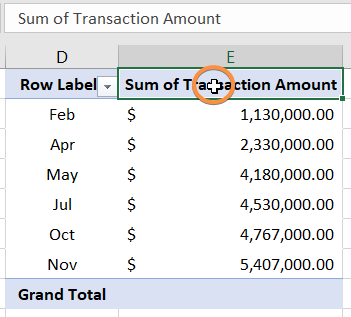
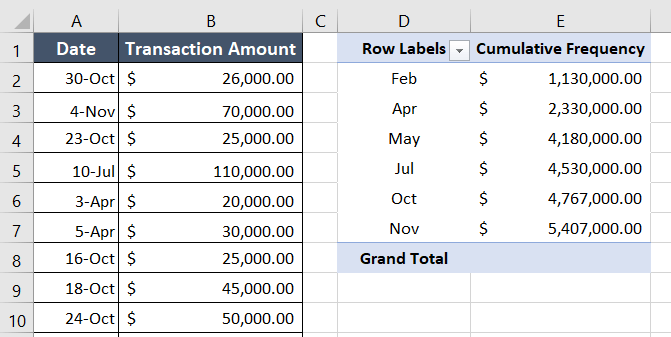
The cumulative frequency calculation results are here in column E.
Additional Steps: Calculate Cumulative Frequency Percentage
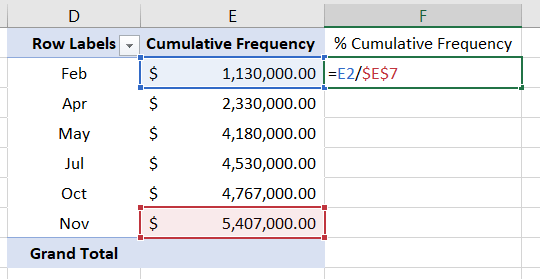
The formula to calculate cumulative frequency percentage is:
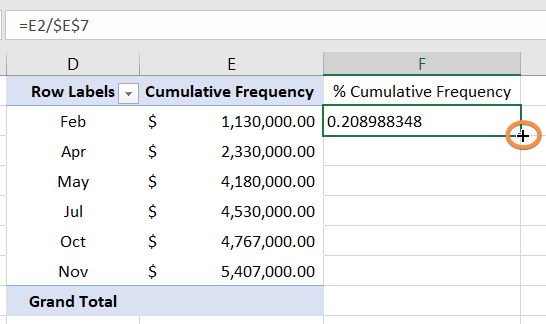
= E2/$E$7Here,
- E2 is the current transaction amount.
- E7 is the total transaction amount. I used the dollar sign ($) before the column and row numbers to add an absolute cell reference.
If you need to calculate the cumulative frequency percentage, follow the below steps:
- Add a new column beside the existing dataset.
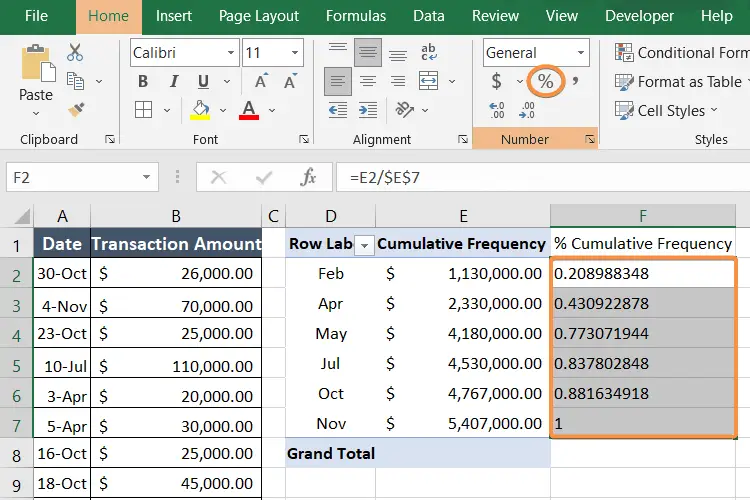
I placed the new column on column F and named it % Cumulative Frequency. - Type the following formula in cell F2: = E2/$E$7
- Press the ENTER key.

- Now copy the formula by dragging the Fill Handle icon from cell F2:F7.

- Next, select the cell range F2:F7.
- After that, go to the Home tab.
- Click on the % (percentage) icon from the Number group.
Columns E and F show the cumulative frequency and % cumulative frequency in the image below.
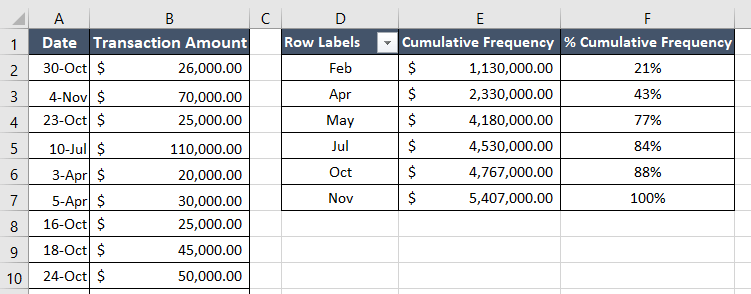
Lastly, I removed the row of Grand Total as it was unnecessary for cumulative frequency. I also used Format Painter. However, you can skip these steps.
Calculate Cumulative Frequency in Excel Using Simply Formula
You can calculate the cumulative frequency by following the basic formula for cumulative frequency. Follow the step-by-step guide to calculating cumulative frequency in Excel below:
- First, create a new column beside the dataset.
I named the column Cumulative Frequency.

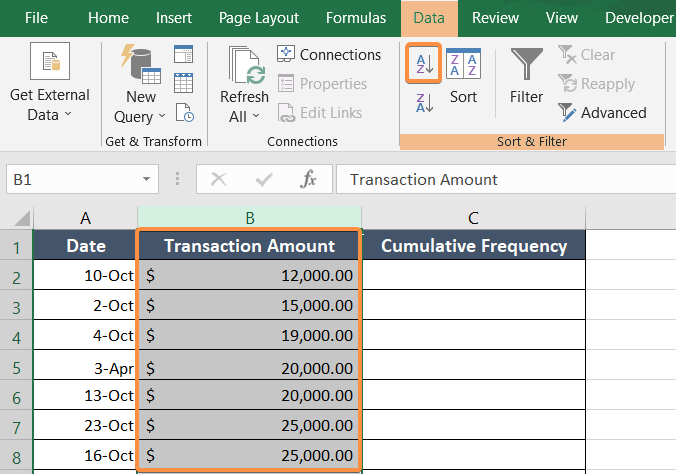
- Next, select the column Transaction Amount.
- Now, go to the Data tab.
- Click on the Sort A to Z icon from the Sort & Filter group.
 This will rearrange the cell range in ascending order.
The Sort Warning message may show up. - Select the option Expand the selection.
- Hit the OK button.

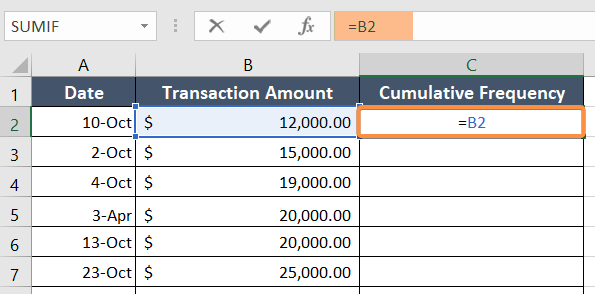
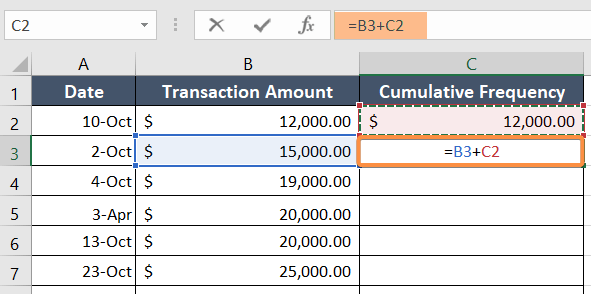
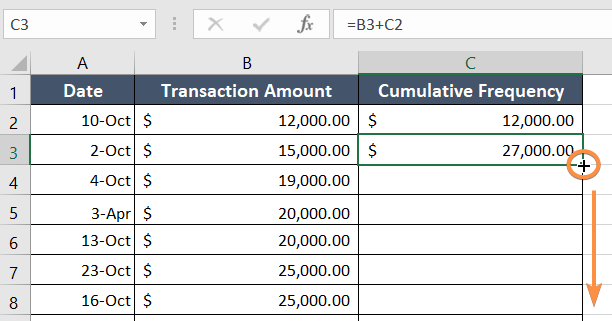
- Next, write the formula in cell C2: =B2
- Press the ENTER key.

- Now, type the formula in cell C3: = B3+C2
- Press ENTER.

- Now, double-click on the Fill Handle icon in the right bottom corner of cell C3.
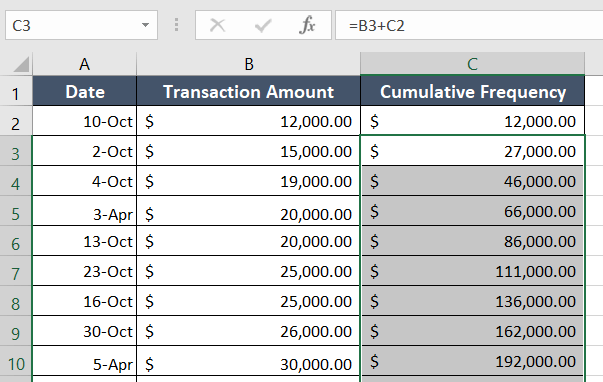
The Fill Handle will copy the formula from cell C3 to the rest of the cells in the column.
This formula to calculate cumulative frequency also gives the same result as the previous method. The final result in both methods is $5,407,000.
However, if you want to group the data, it is better to use the pivot table. The pivot table is also more effective if your dataset is very long.
Cumulative Frequency Table
Generally, we use cumulative frequency tables to analyze continuous variables such as age, height, or weight.
The cumulative frequency tables contain two key elements (class and frequency).
- Class is the intervals or ranges of values of the variable that are being analyzed. The class has a lower and an upper limit.
- Frequency is the number of observations that fall within each class. This can be an absolute frequency or a relative frequency.
Cumulative Frequency Table Example
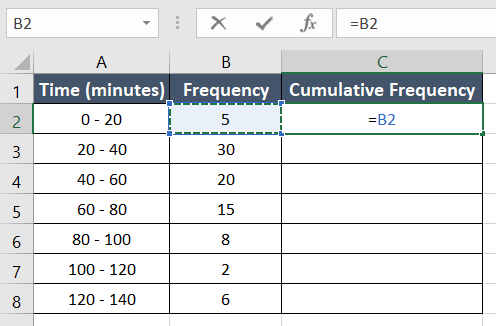
There is a range of time in column A, and the frequency is in column B.
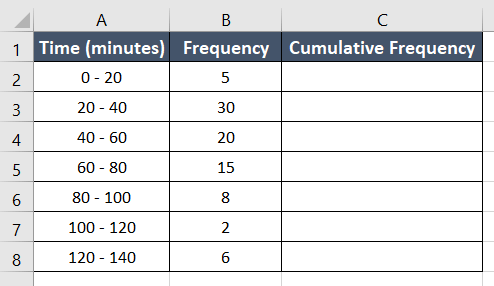
Now, I will complete the cumulative frequency table.
- First, I inserted the following formula in cell C2: = B2
- Then, I pressed ENTER to apply the formula.

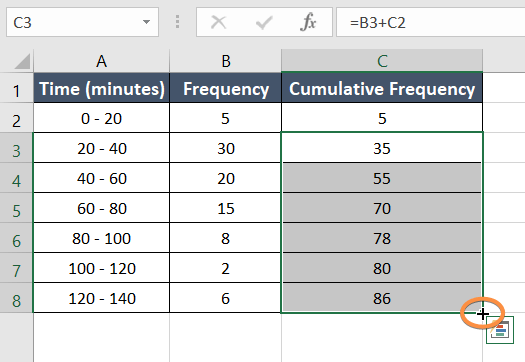
- Next, I applied another formula in cell C3: = B3+C2
- Then hit ENTER.
- Then I copy the formula by dragging the Fill Handle icon into the cell range C3:C8.

This is how you can also complete a cumulative frequency table.
Conclusion
I really hope that you now have a general understanding of what cumulative frequency is and how to calculate it using Microsoft Excel. If you wish to know more about Excel, please visit our blog page at any time. Furthermore, if you encounter any confusion regarding this subject, do not hesitate to ask questions in the comment section. Thank you!
Frequently Asked Questions
Why do we calculate CF?
Cumulative Frequency (CF) is calculated for the following reasons:
- Summarizing Data Distribution: CF provides a way to summarize the distribution of data by showing the running total of frequencies up to a certain point in the dataset.
- Percentiles and Quartiles: CF is essential for calculating percentiles and quartiles, which are statistical measures that divide a dataset into specific percentage or quartile ranges.
- Identifying Patterns: Analyzing the cumulative frequency can reveal patterns in the data, such as the concentration of values within certain ranges.
- Visual Representation: Cumulative Frequency can be used to create a cumulative frequency distribution table or graph, offering a visual representation of the data’s distribution.
- Statistical Analysis: Cumulative Frequency is often employed in statistical analysis to understand the spread and central tendencies of a dataset.
By calculating Cumulative Frequency, analysts and statisticians gain insights into the overall distribution of values and can make informed decisions about the characteristics of the dataset.
What is the difference between frequency and cumulative frequency?
The differences between frequency and cumulative frequency are:
Frequency:
- Frequency represents the number of occurrences of a particular value or range of values in a dataset.
- It is a count of how many times a specific value or range appears in the data.
- For example, in a set of exam scores, the frequency of the score “80” might be 5, indicating that the score “80” appears 5 times in the dataset.
Cumulative Frequency:
- Cumulative frequency, on the other hand, is the running total of frequencies up to a certain point in the dataset.
- It adds up the frequencies as you move through the dataset, providing a cumulative count.
- Using the previous example, if the cumulative frequency of the score “80” is 5, it means that the scores “80” and below have a total frequency of 5 in the dataset.
In summary, while frequency gives the count of occurrences for individual values or ranges, cumulative frequency provides a running total of frequencies up to a specific point in the dataset.
Related Articles
- How to Calculate Total Revenue in Excel [Free Template]
- How to Calculate Profitability Index in Excel [Free Template]
- How to Find Interquartile Range (IQR) in Excel [Free Calculator]
- Calculate Percentage of a Number in Excel [4 Cases Explained]
- Calculate 3 Types of Profit Margin in Excel
- 2 Ways to Calculate Percentage Increase in Excel
 You will see a table formed in your worksheet like the one below.