How to Find the Slope of a Trendline in Excel
Using graphs and charts in business is an intelligent way to represent the data visually. The slope is an element of the charts and graphs. It will help you determine the trend of the charts and predict their coming changes. You can calculate the slope in Excel easily. In this article, I will elaborate on how to find the slope of a trendline in Excel. Let’s begin!
What is a Slope?
The slope of a trendline measures the degree to which the dependent variable (Y-axis) changes for each unit of change of the independent variable (X-axis). It shows the steepness of the Y-axis and X-axis in the chart.
Mathematically, the slope is calculated from the equation of a straight line.

Introduction to the Dataset
Here, I have presented the dataset of the number of hours I studied and the corresponding earned test scores.

Easiest Way: Use the SLOPE Function to Find the Slope of a Trendline in Excel
The simplest way to determine the slope of the trendline is to use the SLOPE function if you have the data for the independent and dependent variables. The function will instantly calculate the trendline slope when you enter the X and Y values.
Syntax
=SLOPE(known_ys, known_xs)Here,
- known_ys is the cell range of dependent variables of Y-coordinates.
- known_xs is the cell range of independent variables of X-coordinates.
Formula
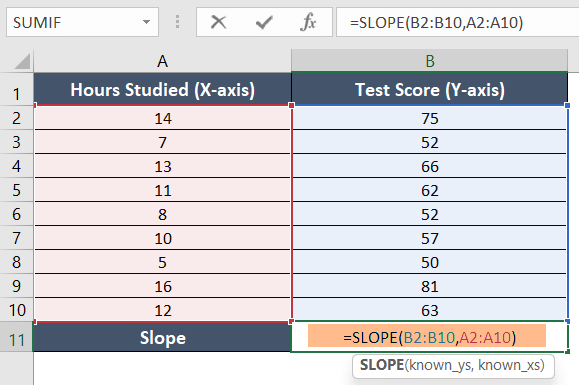
=SLOPE(B2:B10,A2:A10)Usage Guide
Step_1: Select an empty cell, cell B11, in the sheet.
Step_2: Now type the formula in the cell.
Step_3: Press the ENTER key to apply the formula.
Formula Explanation
- B2:B10 is the cell range of the dependent values, the known Y-values.
- A2:A10 is the cell range of the independent values, the known X-values.
Final Result >
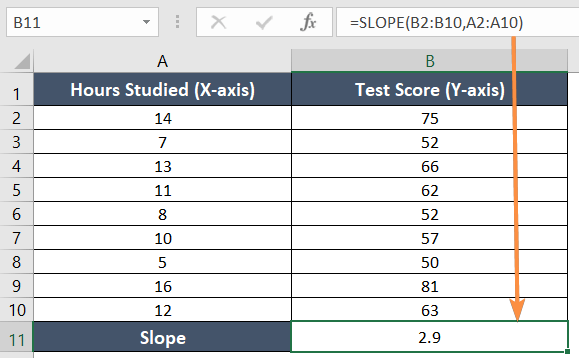
The value of the trendline slope is 2.9. This indicates that by studying for 1 hour, the test can increase by 2.9.
Things to Remember While Using the SLOPE Function
- Ensure that the known_y’s and known_x’s arguments are of equal length and correspond to the same set of data points.
- The SLOPE function only works with numeric data.
- If your data contains missing values, represented by empty cells or cells with text, you may encounter #N/A errors.
- A single set of y and x variables will not give any result. It will show the #DIV! error.
Alternative Way #1: Use the Scatter Plot to Find the Slope of a Trendline in Excel
Another way to find out the slope value of the trendline in Excel is by using the scatter plot. It will also help you display the chart in a scatter plot with a trendline.
Usage Guide
Step_1: First, select the cell range A1:B10.
Step_2: Now go to the Insert tab.

Step_3: Next, select the Scatter plot from the Charts group.

The scatter chart will appear on the worksheet like the one I have below.

Step_4: Then click on the plus (+) sign beside the scatter chart to open the Chart Elements.
Step_5: From the drop-down menu, select Trendline>Linear.

The trendline will appear above the chart instantly.
Step_6: Then click on More Options from the menu.

The Format Trendline tab will pop up on the right side of the screen.
Step_7: Check mark the option Display Equation on Chart.

Final Result >
Like the following image below, the equation will take place beside the trendline.
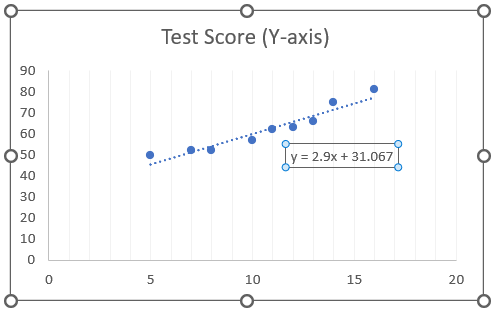
The equation here is y = 2.9x + 31.067. According to the equation of the straight line (y = mx + c), the value of the slope is 2.9.
Alternative Way #2: Using the Equation of Slope to Find the Slope of a Trendline in Excel
Another easy way to find the slope of the trendline in Excel is by using the mathematical formula to calculate the slope. Sometimes you may not remember the other methods to find the slope. In such cases, just enter the mathematical formula for the slope in Excel.
The Formula of Slope
=(Y2-Y1)/(X2-X1)Here
- Y2 is the new value of the Y variable.
- Y1 is the old value of the Y variable.
- X2 is the new value of the X variable.
- X1 is the old value of the X variable.
Usage Guide
Step_1: Select the first column cell range, A1:A10.
Step_2: Then go to the Home tab.
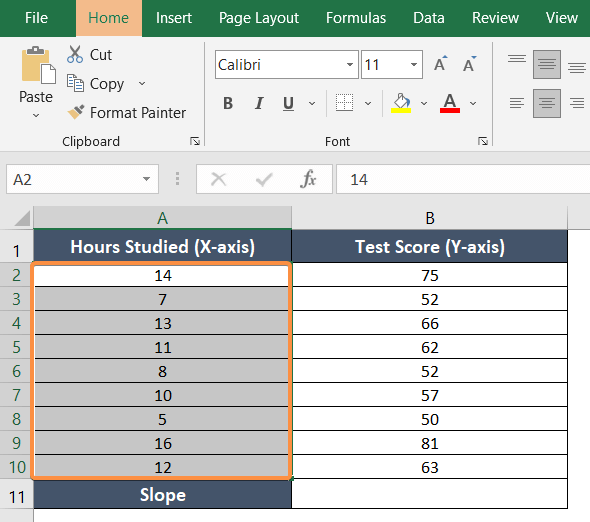
Step_3: Then click on the Sort & Filter drop-down menu from the Editing group.
Step_4: Select Sort Smallest to Largest.

The Sort Warning dialog box will show up.
Step_5: Now select the option Expand the selection.
Step_6: Hit Sort.

This will organize the values of the X-axis with the corresponding Y-axis from smallest to largest order.
Step_7: Now type the formula in cell B11.
=(B10-B2)/(A10-A2)
Formula Explanation
- B10 is the largest value of the Y-axis.
- B2 is the smallest value of the Y-axis.
- A10 is the largest value of the X-axis.
- A2 is the smallest value of the X-axis.
Step_8: Now hit the ENTER key.
Final Result >
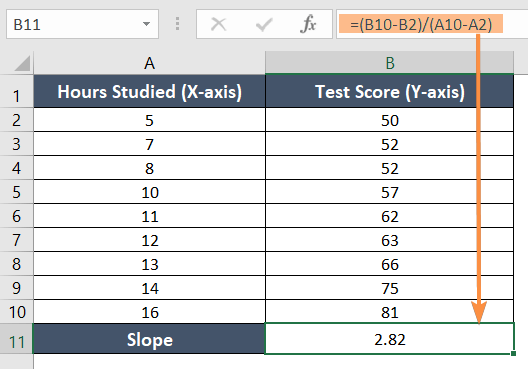
The value of the slope for the corresponding dataset is 2.82 which is a positive value.
Understanding the Significance of the Slope
The slope or gradient provides an important understanding of the relationship between variables. The value of the slope can be positive, negative, or zero.
- If the slope is positive, the dependent variable increases as the independent variable increases.
- If the slope is negative, the dependent variable decreases as the independent variable increases.
- If the slope is zero, the dependent variable will change equally with the independent variables. It will be a horizontal line.
Conclusion
Applying any of the above methods, you can easily find the slope of the trendline in Excel. I hope you find the techniques helpful. Please let us know if you find anything confusing or have feedback about the article. Keep Excelling!
