How to Create a Correlation Graph in Excel Correctly
Correlation graphs help determine the linear relationship between two types of variables. The variables are placed on a vertical and horizontal axis for creating the graphic. To make a perfect correlation graph with a trendline, trendline equation, axis points, axis titles, etc., using Microsoft Excel is the best way. In this article, I will show you how you can create a correlation graph in Excel.
What is a Correlation Graph?
A correlation graph, also known as a scatter plot or correlation plot, is a type of data visualization used to explore and display the relationship between two variables. It typically consists of a two-dimensional graph with one variable on the x-axis and the other on the y-axis. Each data point on the graph represents a pair of values for these two variables.
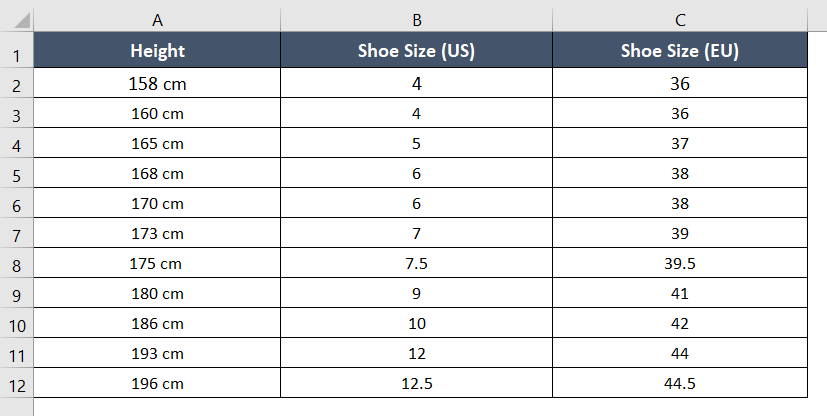
In my sample data, I’ve taken a list of shoe sizes for people of various heights, using US and EU standards. Using this dataset, I will show you how to create a correlation graph in Excel. So let’s jump right into it.
Steps to Create a Correlation Graph in Excel
To create a correlation graph (scatter plot) in Excel, follow these steps:
Step 1: Select Your Data
First, select cell range A1:A12, press CTRL, and select cell range C1:C12 again.
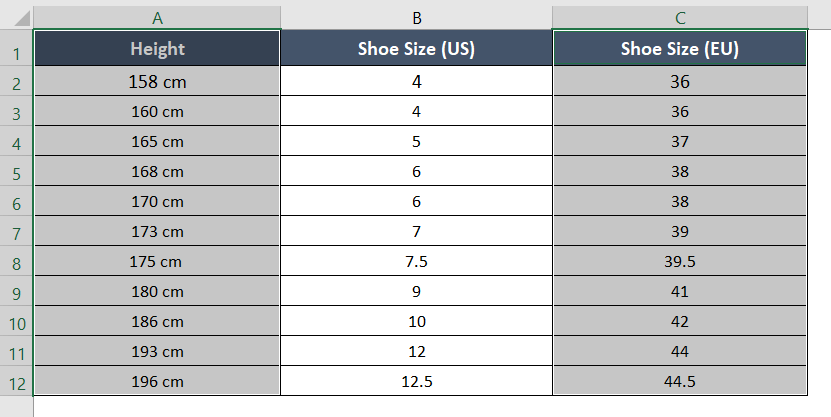
Here, values from column Height are for the Y-axis, and values from columns Shoe Size (US) and Shoe Size (EU) are for the X-axis. You can select either column Shoe Size (US) or Shoe Size (EU) for X-axis plotting in the correlation graph.
Step 2: Insert Scatter Plot
To insert the scatter plot:
- Go to the Insert tab.
- Select the Scatter plot from the Charts group.
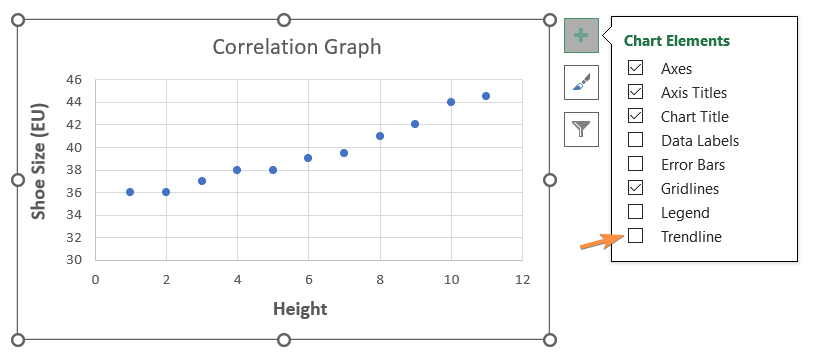
 The correlation graph will appear on the screen right away.
 - Click on the plus (+) symbol in the top-right corner of the chart. The Chart Elements drop-down menu will open up.
- Select the Trendline checkbox from the Chart Elements menu.
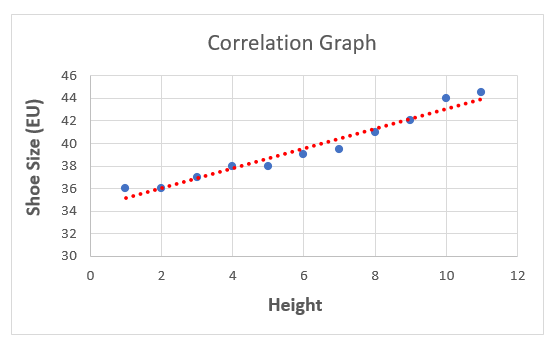
 You will see a trendline like this one in the below image:
Step 3: Customize the Chart
You can customize the appearance of the chart according to your choice. To do that:
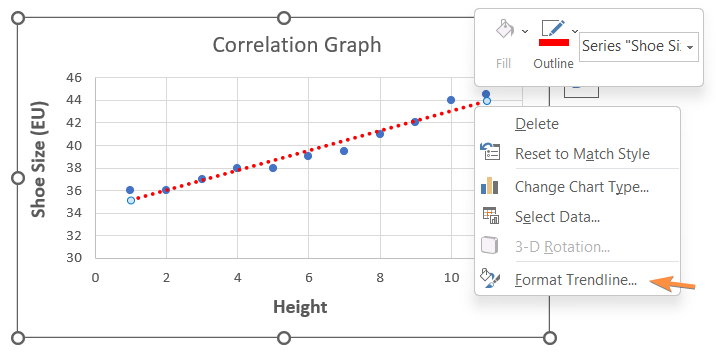
- Right-click on the trendline. The Context Menu will appear.
- Select Format Trendline.
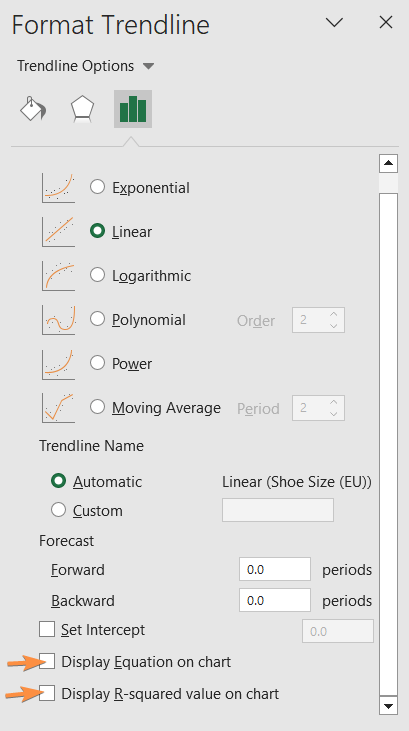
 The Format Trendline task pane will take place on the right side of your computer screen.
 - Select Display Equation on Chart.
- Select Display R-Squared Value on the Chart.

A complete correlation graph is ready for you!

The correlation graph shows an inclining trend in the image above.
What are the Types of Correlation?
Types of correlation depend on the meeting point of variables or attributes in the scatter plot. It expresses the closeness between the variable connections. You can find three situations in the correlation plots:

1. Positive Correlation
The upward or downward movement of one variable will occur after the increase or decline of another variable if there is a positive correlation. A strong positive correlation is scaled at +1.
2. Negative Correlation
In the case of a negative correlation, the two sets of variables move in the opposite direction. Here, one variable declines when the other rises. A strong negative correlation is scaled at -1.
3. No Correlation
It is an irregular correlation. When the variables do not show any linear relation in their change, it will be considered a no-correlation or zero-correlation situation. A no correlation or zero correlation is scaled at 0.
Conclusion
After reading this article, I hope you can now successfully create a correlation graph in Excel and also determine the nature of the correlation graph according to its type. Please share your thoughts about this article in the comment box. Have a good day!
Frequently Asked Questions
What is the best Excel graph for correlation?
The best Excel graph for displaying the correlation between two variables is a “Scatter Plot” or “Scatter Chart.” A scatter plot is ideal for visualizing the relationship between two sets of data points because it displays individual data points on a two-dimensional graph, making it easy to observe correlations, trends, and patterns. You can also add a trendline to the scatter plot to further analyze the correlation and make predictions based on the data.
What should a correlation graph look like?
A correlation graph, typically a scatter plot, should exhibit the following characteristics:
- Direction: The general trend of the data points should show either a positive correlation (data points sloping from bottom-left to top-right, indicating both variables increase together) or a negative correlation (data points sloping from top-left to bottom-right, indicating one variable increases as the other decreases).
- Strength: The strength of the correlation is determined by how closely the data points cluster around a trendline. A strong correlation will have points closely grouped around the line, while a weak correlation will have more scattered points.
- Outliers: Outliers, if present, may deviate from the main trend. These are data points that do not follow the overall correlation pattern and should be noted for further analysis.
- Trendline: A trendline (or regression line) may be added to the graph to mathematically represent the correlation. It summarizes the relationship between the variables and can be used for predictive purposes.
In summary, a correlation graph should visually show the direction and strength of the correlation between two variables, making it easier to interpret and analyze the relationship.
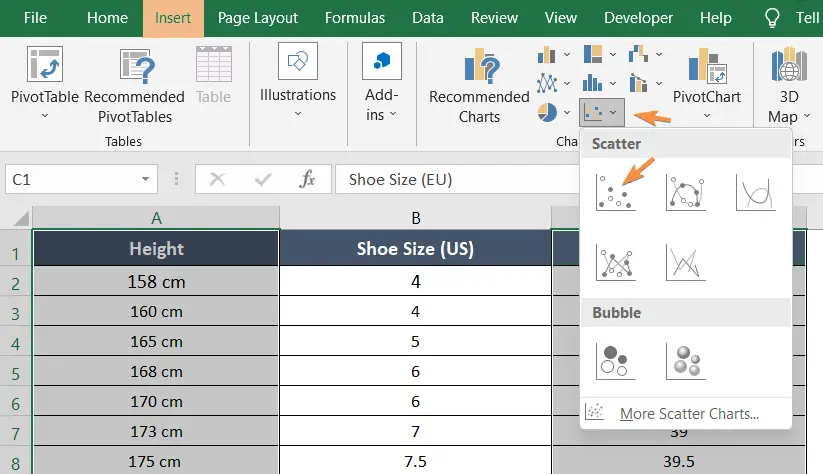 The correlation graph will appear on the screen right away.
 You will see a trendline like this one in the below image:
 The Format Trendline task pane will take place on the right side of your computer screen.