An Overview of the Bar Chart in Excel
The Bar Chart and the Column Chart are technically the same thing. Using the Bar Chart is suitable when your dataset is comparably larger than a standard Column Chart’s dataset. In this article, I will describe how to use a Bar Chart in Excel and what its main features are.
What is a Bar Chart?
It is a type of Chart that uses rectangular narrow bars to represent the data in the graph. The bars are arranged side by side or on top of one another in the Bar Chart. The length or height of the bars represents the values of the dataset.
Create a Bar Chart in Excel
To create a bar chart in Excel, please follow the steps below:
Usage Guide
Step_1: Select the data range.
Step_2: Click on the Insert tab in the Excel ribbon.
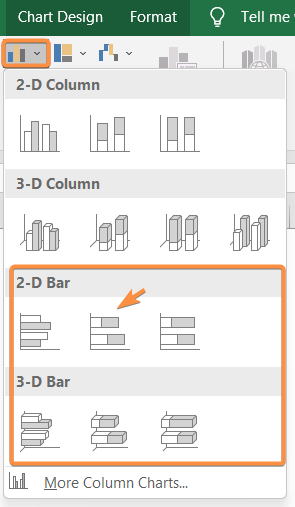
Step_3: Choose the Insert Chart or Bar Chart command from the Charts group.

It will open a drop-down menu.
Step_4: Pick your preferred Bar Chart from the menu.
I have chosen the Stacked Bar Chart.
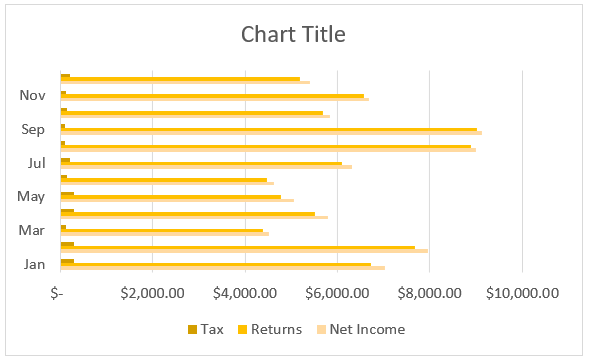
Excel will take the data from the data range, and immediately the Bar Chart will appear on the worksheet.
Features of the Bar Chart in Excel
1. Switch Row/Column
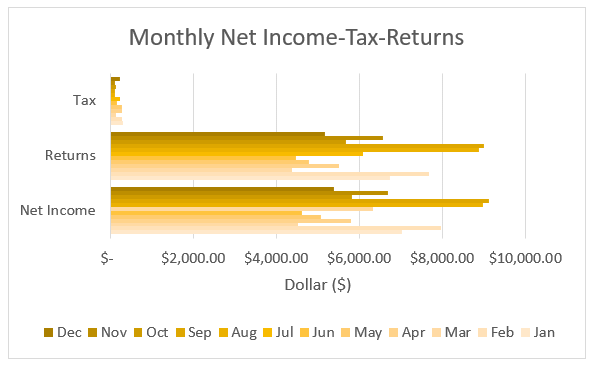
If you want to alternate the data position from horizontal to vertical, you can use the Switch Row/Column command.
To find the option Switch Row/Column, first double-click on the chart on the sheet. Then go to the Chart Design tab. After that, click on the Switch Row/Column icon from the Data group.

As I applied the Switch Row/Column command, the position of the vertical and horizontal axis switched instantly.
2. Chart Styles and Chart Colors
Decorate your Bar Chart with different themes and color options from the Chart Tools > Chart Design > Chart Styles.

3. Change Bar Chart Layout
You can explore the pre-built layouts in the Quick Layout feature in Excel. It offers a range of layout models and saves you a lot of time.
To find the Quick Layout command, follow Chart Tools > Chart Design > Chart Layouts > Quick Layout.

4. Edit Chart Elements
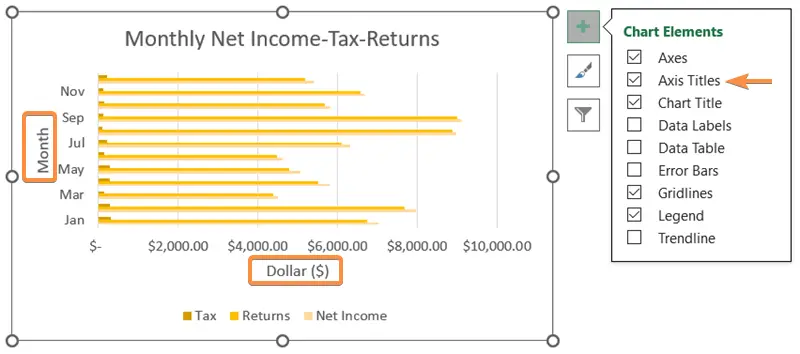
Double-click on the Bar Chart. Three options will appear beside it. Then click on the top + icon to open the Chart Elements drop-down menu.
Some important chart elements are described below:
A. Axis Titles
The axis labels are easier to understand with the Axis Titles. For this reason, adding the Axis Titles is necessary for a chart. Otherwise, it would look incomplete.
To add Axis Titles to a Bar Chart follow Chart Elements > Axis Titles.
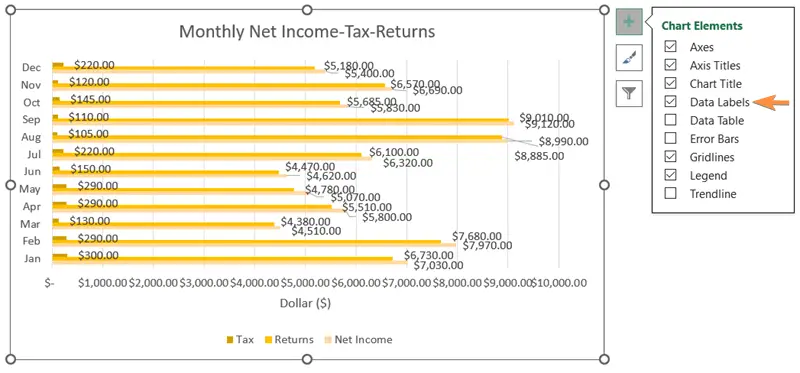
B. Data Labels
You can use the Data Labels in your Bar Chart. The Data Labels will help the viewers to navigate the values of each bar.
C. Data Table
The Data Table can be an alternative option for you to the Data Labels. All the values will be present in the form of a small table below the Bar Chart in Excel.

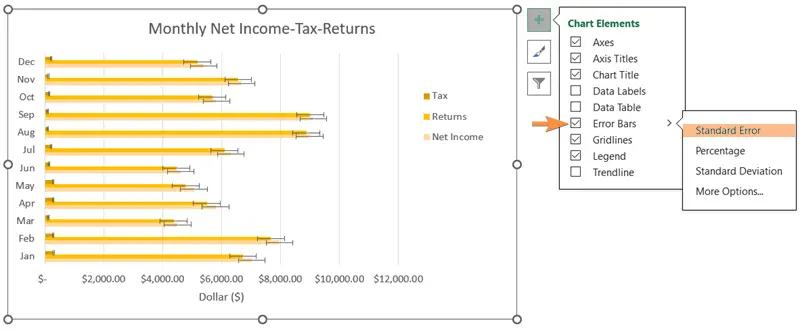
D. Error Bars
Sometimes you may need to add the Error Bars. The Chart Elements section has an option for adding Error Bars. You can create Error Bars of Standard Errors, Percentages, Standard Deviations, etc.
E. Trendline
A Trendline is helpful for analyzing the movement of values over a period of time. Excel has a range of options for Trendlines, like Linear, Exponential, Linear Forecast, 2 Period Moving Average, etc. To add a Trendline, go to Chart Elements > Trendline.

5. Filter the Bar Chart in Excel
If you want to display particular sections of data, then apply the Filter command. In the Filter drop-down menu, give a checkmark to only those options that you want to represent. Then click on the Apply button to save the changes.
6. Format Data Series Pane
Another charting tool is the Format Data Series pane. Click on the lines of the Bar Chart to open the Format Data Series pane. The color, width, transparency, and compound of the Bar Chart can be altered from here. You can also add starting arrows and ending arrows, as well as shadow and glow effects, to both the lines and markers.

7. Add Secondary Axis
Sometimes you will need to add vertical axes on both sides to guide the lines with different parameters. In this situation, add another axis on the right side of the chart with the Secondary Axis command. To open the Secondary Axis, follow Format Data Series > Series Options > Secondary Axis.

Conclusion
I hope you got an overall idea of the Bar Chart and how to use it in Excel. Visit our website if you want to learn more about Microsoft Excel. Please let me know in the comment box if you have any questions regarding the Bar Chart. Thank you!
Excel Glossary | Excel Charts | Pie Chart | Line Chart | Column Chart | Pivot Chart

