Skip to content
Excelgraduate

Excelgraduate

A to Z Solution Provider

  • Home
  • Blog
  • CategoriesExpand
    • Basic Excel
    • Advanced Excel
    • Excel Functions
    • Excel Formulas
    • Pivot Table
    • Power Query
    • Visual Basic
    • Excel for Business
    • Excel Glossary
  • About
  • Contact
Excelgraduate
Excelgraduate
A to Z Solution Provider
An Overview of the Bar Chart in Excel
Excel Glossary

An Overview of the Bar Chart in Excel

Rhidi Barma June 5, 2023October 2, 2023 Excel Glossary

The Bar Chart and the Column Chart are technically the same thing. Using the Bar Chart is suitable when your…
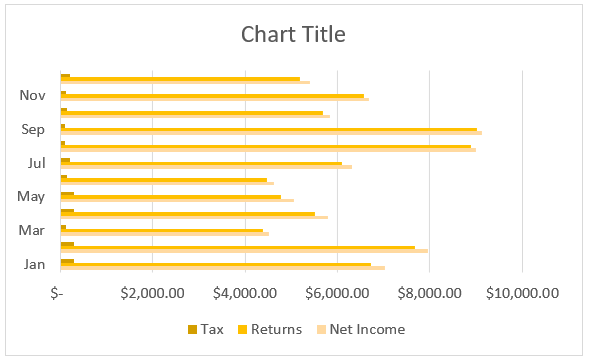
Read More An Overview of the Bar Chart in ExcelContinue

An Overview of the Line Chart in Excel
Excel Glossary

An Overview of the Line Chart in Excel

Rhidi Barma June 3, 2023November 4, 2023 Excel Glossary

A Line Chart is used to display the trend and pattern lines over time. It is a very simple form…
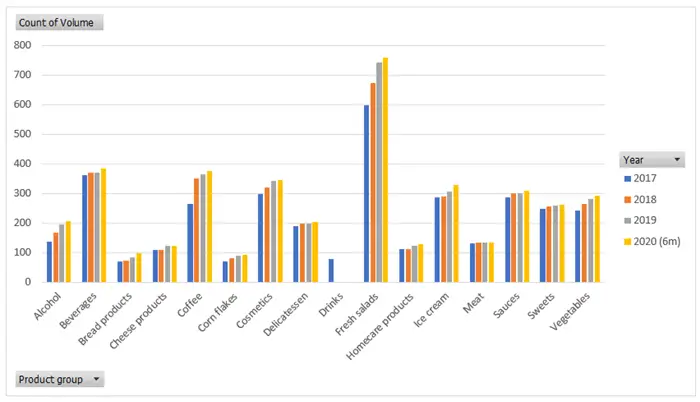
Read More An Overview of the Line Chart in ExcelContinue

Data Visualization with Pivot Chart in Excel
Excel Glossary

Data Visualization with Pivot Chart in Excel

Rhidi Barma May 26, 2023October 2, 2023 Excel Glossary

Excel offers various tools for data analysis. One of its most powerful features is the pivot chart. The best thing…
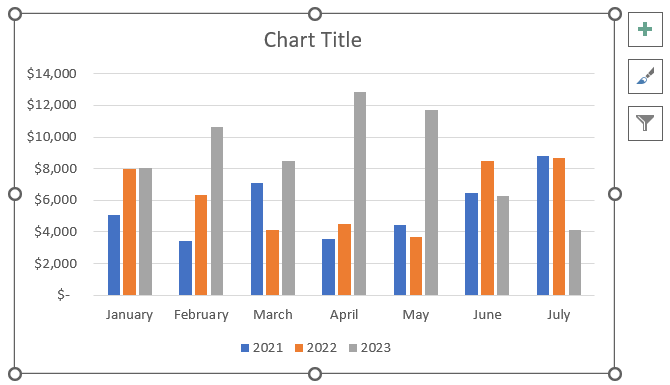
Read More Data Visualization with Pivot Chart in ExcelContinue

How to Create a Clustered Column Chart in Excel
Excel Glossary

How to Create a Clustered Column Chart in Excel

Rhidi Barma May 21, 2023October 2, 2023 Excel Glossary

Clustered column charts make a large dataset easy to understand, even for people who are not familiar with data analysis…
Read More How to Create a Clustered Column Chart in ExcelContinue

How to Create a Pie Chart in Excel?
Excel Glossary

How to Create a Pie Chart in Excel?

Rhidi Barma May 20, 2023October 2, 2023 Excel Glossary

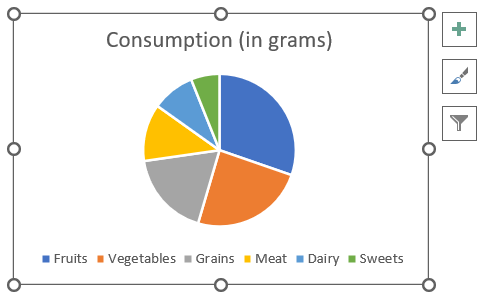
Pie charts are used to explain statistical reports, and they are very popular because they are easy to understand. In…
Read More How to Create a Pie Chart in Excel?Continue

How to Create a Chart in Excel
Excel Glossary

How to Create a Chart in Excel

Rhidi Barma May 20, 2023October 2, 2023 Excel Glossary

Charts are a tool that can display the data in a way that gives users the ability to easily understand…

Read More How to Create a Chart in ExcelContinue

  • About
  • Blog
  • Contact

Excelgraduate

A to Z Solution Provider

DMCA.com Protection Status
  • Disclaimer
  • Privacy Policy
  • Terms & Conditions
YouTube YouTubeFacebook FacebookTwitter TwitterLinkedin LinkedinPinterest Pinterest

Copyright © 2023 Excelgraduate | All Rights Reserved.

Scroll to top
  • Home
  • Blog
  • Categories
    • Basic Excel
    • Advanced Excel
    • Excel Functions
    • Excel Formulas
    • Pivot Table
    • Power Query
    • Visual Basic
    • Excel for Business
    • Excel Glossary
  • About
  • Contact
Purchase
Search