An Overview of the Line Chart in Excel
A Line Chart is used to display the trend and pattern lines over time. It is a very simple form of data representation. It helps to represent the growth in simple ways. Thus, it is so famous among Excel users. In this article, I will give you an overview of the Line Chart and how to create it in Excel.
What is a Line Chart in Excel?
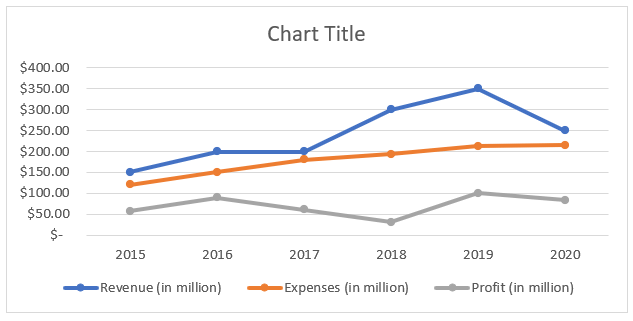
Line Charts are one kind of chart that is created by data points connected by straight lines. Mainly, it is used to depict growth over time. Line Charts are an amazing tool for making any decision regarding trendlines. The most common use of the Line Chart is in stock prices, sales figures, population growth, temperature variations, etc.
Create a Line Chart in Excel
To create a Line Chart, follow this guideline:
Usage Guide
Step_1: Prepare the dataset.
Your dataset must have two or more columns. Keep the independent values in the left column and the dependent values in the right column.
Step_2: Do not include any names in the column header of the left column (independent column), cell A1.

When you do this, Excel won’t identify column A as a series of values and automatically input positioned the values on the horizontal axis.
Step_3: Select the data range A1:D7.
Step_4: Go to the Insert tab.
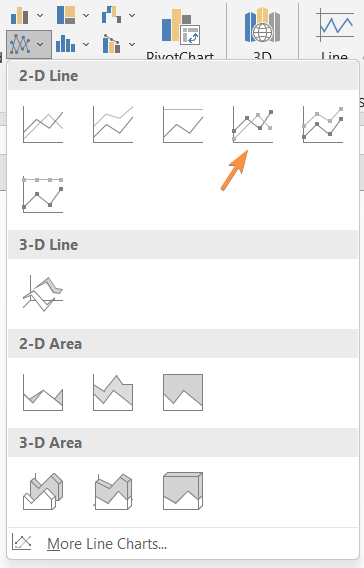
Step_5: From the Charts group, click the Insert Line or Area Chart icon.

This will open a drop-down menu with Line Chart formats.
Step_6: Pick your preferred Line Chart from the menu.
I chose the option Line with Markers from the 2-D Line section.
The Line Chart will instantly appear on the worksheet.
Features of Line Chart in Excel
1. Switch Row/Column
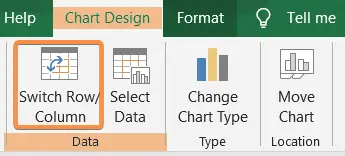
If you want to alternate the data position from horizontal to vertical, you can use the Switch Row/Column command.
To find the option Switch Row/Column, first double-click on the chart on the sheet. Then go to the Chart Design tab. After that click on the Switch Row/Column icon from the Data group.
However, it is easy to create the Line Chart when you insert the horizontal value in the left column and the vertical value in the right column(s).
2. Chart Styles and Chart Colors
Decorate your Line Chart with different themes and color options from the Chart Tools>Chart Design>Chart Styles.

3. Change the Line Chart Layout
You can explore the pre-built layouts in the Quick Layout feature in Excel. It offers a range of layout models and saves you a lot of time.

To find the Quick Layout command, follow Chart Tools>Chart Design>Chart Layouts>Quick Layout.

4. Edit Chart Elements
Double-click on the chart. Three options will appear beside it. Then click on the top + icon to open the Chart Elements drop-down menu.

Explore some useful features like Axis Titles, Data Labels, Legends, Trendline, etc.
5. Format Data Series Pane
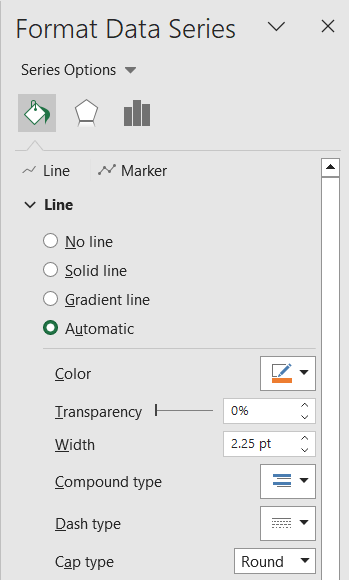
Another charting tool is the Format Data Series pane. Click on the lines of the Line Chart to open the Format Data Series pane. The lines’ color, width, transparency, and compound can be altered. You can also add starting and ending arrows, as well as shadow and glow effects, to both the lines and markers.
6. Add a Secondary Axis in the Line Chart
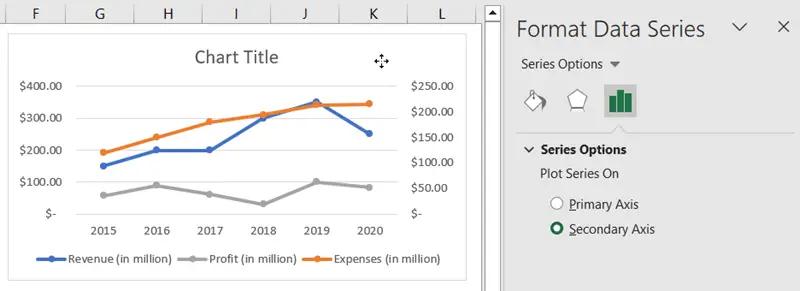
Sometimes you will need to add vertical axes on both sides to navigate lines with different parameters. In this situation, add another axis on the right side of the chart with the Secondary Axis command. To open the Secondary Axis, follow Format Data Series > Series Options > Secondary Axis.
7. Filter the Line Chart in Excel
If you want to display particular sections of data, then apply the Filter command. In the Filter drop-down menu, give a checkmark to only those options that you want to represent.

Benefits of Using the Line Chart in Excel
There are a number of advantages of using a Line Chart in Excel. Some of them are listed below:
- Easy to identify patterns and growth rates.
- Compares different data records of the same period.
- Can highlight peaks easily.
- Easy to understand for those who have limited data analysis knowledge.
Conclusion
I hope you got an overall idea of the Line Chart and how to use it in Excel. Please let me know in the comment box if you have any questions regarding the Line Chart. Thank you!
Excel Glossary | Excel Charts | Pie Chart | Bar Chart| Column Chart | Pivot Chart