How to Create a Pie Chart in Excel?
Pie charts are used to explain statistical reports, and they are very popular because they are easy to understand. In a pie chart, the entire circle represents the total value, and each slice represents the contribution of each item. In this article, I will guide you through the process of creating a pie chart in Excel so you can effectively show your data. You can easily make one after reading this article.
Introduction to the Dataset
I have created a sample dataset that I will use to create a pie chart for this article. Here it is:
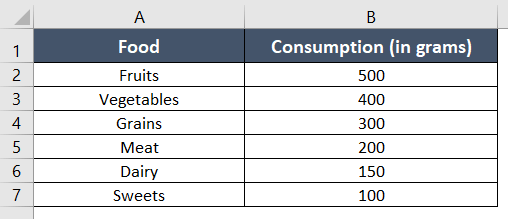
This dataset represents the average daily consumption of various food categories, including Fruits, Vegetables, Grains, Meat, Dairy, and Sweets. I will use this dataset to create a pie chart to visualize the proportion of different food categories.
Create a Pie Chart in Excel
Step_1: Select the data you want to include in the chart, cell range A1:B7.
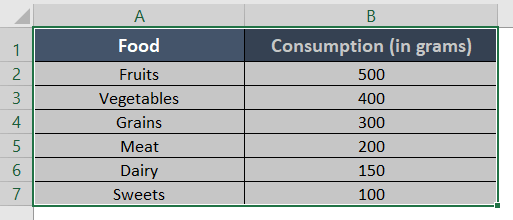
Tip: If your data is in a non-adjacent range, hold the CTRL key while selecting each range.
Step_2: Select the Insert tab from the ribbon.
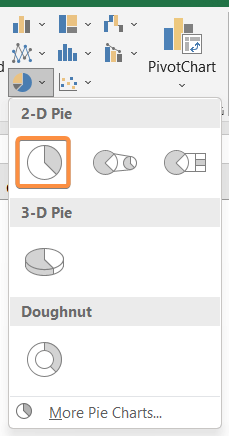
Step_3: Click on the pie chart icon in the Charts group.

A drop-down menu will appear with various pie chart options.
Step_4: Choose the desired pie chart style by clicking on it.
I chose the first option from the drop-down list.
Final Result
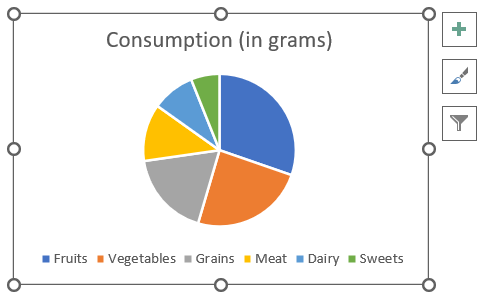
Excel automatically created a pie chart based on the selected data. Now I will show you how to modify the pie chart.
Customize Pie Chart in Excel
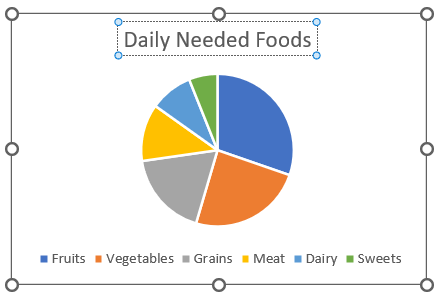
1. Add Chart Title
To add a title to your chart, double-click on the space of the Chart Title and rewrite it.
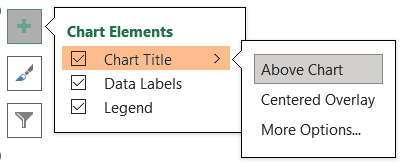
You can change the position of the chart title by going to Chart Elements>Chart Title.
2. Add Data Labels
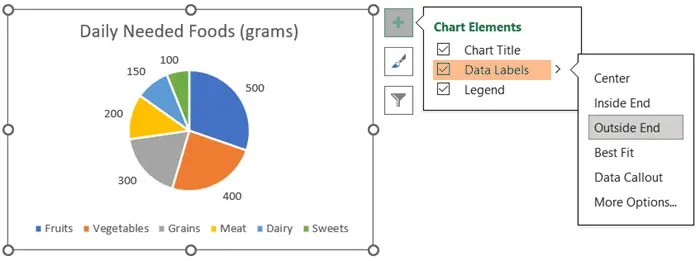
To display data labels on your pie chart, right-click on any slice and select Add Data Labels. You can customize the appearance of the labels and position by right-clicking them again and selecting Format Data Labels.
3. Chart Style and Colors
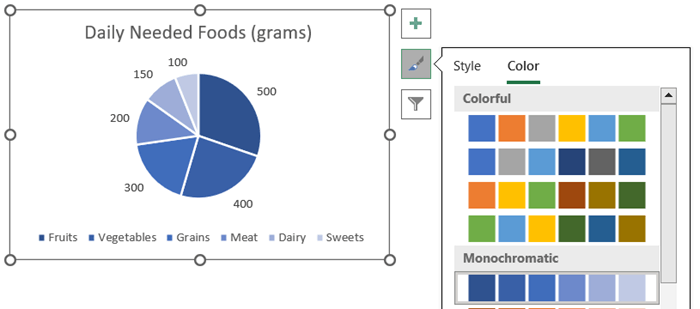
Select the pie chart, and then click on the second icon from the right side of the pie chart. This will reveal the commands for Style and Color themes.
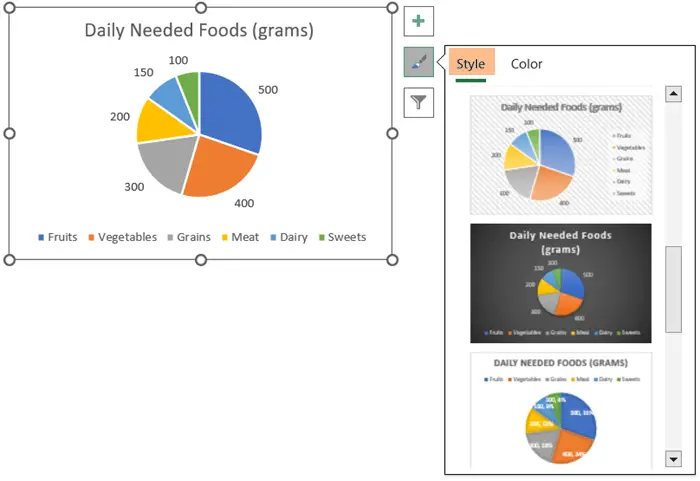
You can change the color palette of the slices using the Color section.
4. Change the Position of the Legend
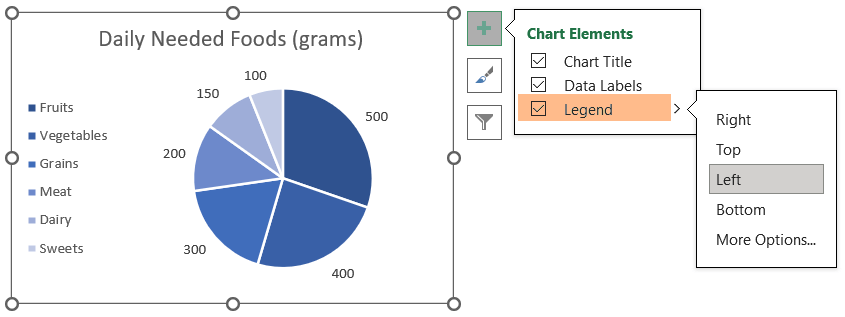
To change the position of the legend on the pie chart, go to the Chart Elements and pick the suitable location of the legend from the Legend section.
5. Change the Angle of the Slices
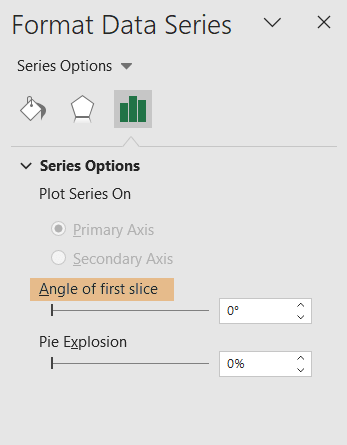
Right-click on the pie and this will open the Format Data Series task pane. You can rotate the pie chart from the Agle of First Slice section.
6. Exploding Slices
To highlight a specific slice in your pie chart, you can disperse the slices. First, double-click on the slice you want to scatter and then follow Format Data Series > Point Explosion.
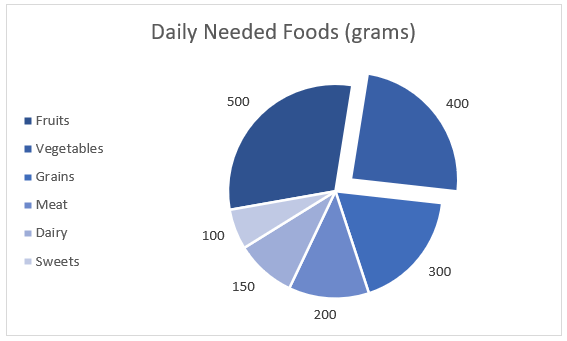
An alternative way is manually dragging the slice away from the rest of the pie.
7. Change the Font of the Data Label
Click on any of the slice labels. A drop-down menu will show up.
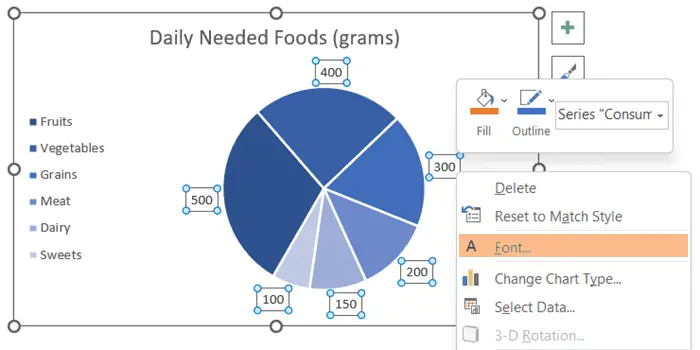
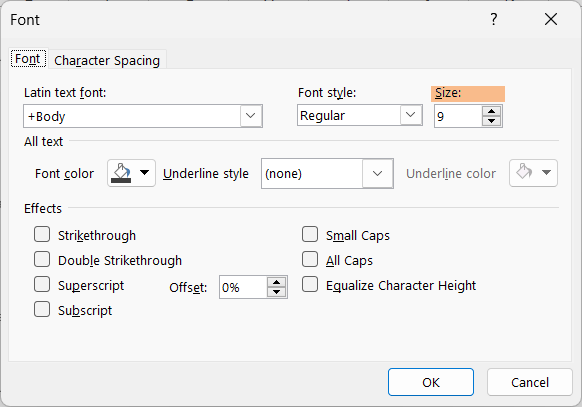
This will take you to the Font dialog box. You can customize the font style, size, color, and other settings directly from the Font dialog box.
Create Pie of a Pie Chart
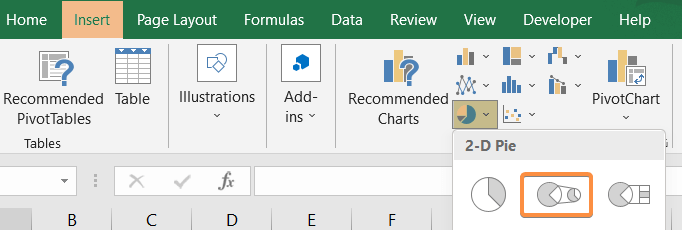
To create a Pie of Pie chart, you will need to follow the same steps as creating a basic pie chart, with the exception of selecting the second icon of the 2-D Pie section.
Similarly, when it comes to editing the chart, you will follow the same process as you would with a basic pie chart.
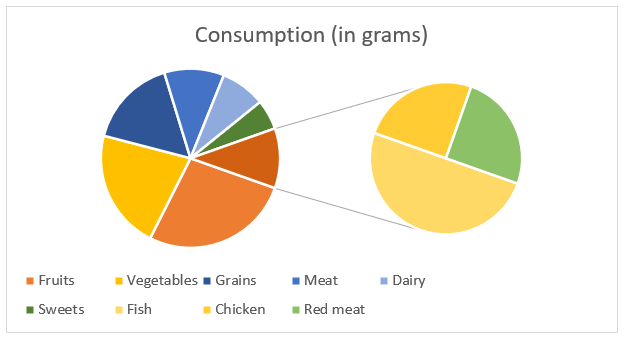
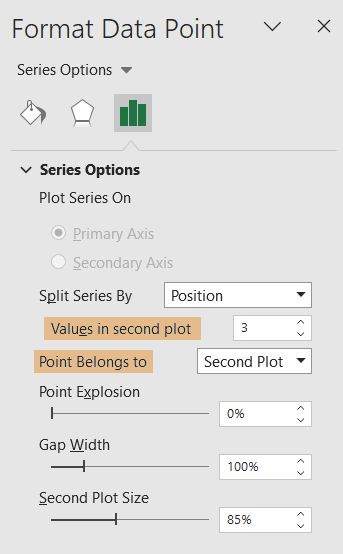
To arrange the slices between the two pie charts, simply select any slice first. The Format Data Series task pane will appear on the right side of the screen.
In the Split Series By menu, select Position. You can change the number of slices in the second plot with the Values in the Second Plot command. You can also specify which point you want in which pie chart with the Point Belongs To command.
Create a Bar of a Pie Chart
A bar of a pie chart is a special kind of chart that uses bars instead of slices to represent categories.
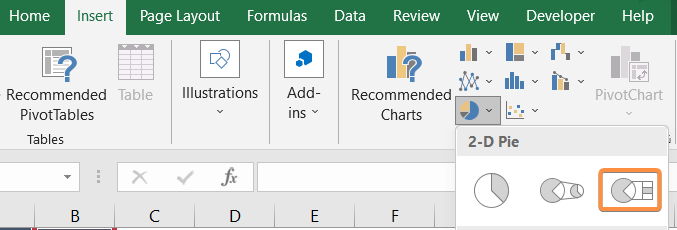
The procedure for making the bar of a pie chart is the same as for making a pie chart. You need to click on the third option from the 2-D Pie section to open the bar of a pie chart.
The length of each bar shows how big or important the category is.
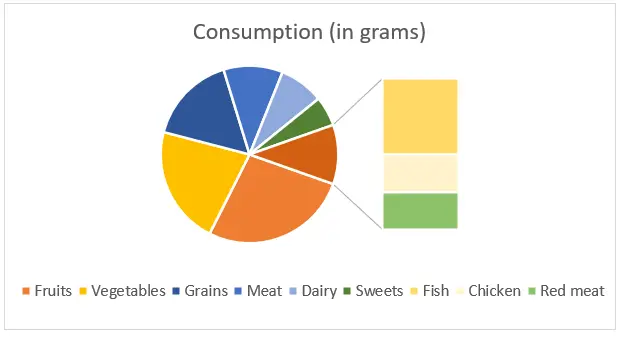
The methods and steps for customizing the bar of a pie chart are similar to customizing a regular pie chart.
Conclusion
In conclusion, creating a pie chart in Excel is easy and helps visualize data effectively. It’s a valuable tool for presenting information in various contexts, making your data clear and impactful. By following a few simple steps, you can easily transform raw data into a clear and concise graphical display. This essay should be useful to you the next time you are making a pie chart in Excel. Thank you!
Excel Glossary | Excel Charts | Bar Chart | Line Chart | Column Chart | Pivot Chart