How to Calculate Profitability Index in Excel [Free Template]
Calculating the profitability index is important before making any investment decisions. It is used to compare different investment opportunities. If two investments have the same initial investment cost, the profitability index helps decide which one to finance first. To make this work easier, Excel offers to calculate the profitability index accurately. In this article, I will show you how to calculate the profitability index in Excel and also give you an overview of it.
What is Profitability Index?
The profitability index is one kind of financial evaluation technique. You can use it to evaluate the potential of a company to generate profit from an investment. It is also known as the benefit-cost ratio.
Let’s say you want to invest in a project. Before making an investment, making a projection about the profits is very necessary. Otherwise, the investment may bring you a loss rather than a profit. In such situations, the profitability index will tell you whether you should invest in the project.
Profitability Index Formula
To calculate the profitability index, the present value of the expected future cash flows of an investment is divided by the initial investment cost.
Profitability Index, PI = PV of the Future Cash Flows of an Investment/Initial Investment
= 1+ (NPV/Initial Investment)
Here,
PI = Profitability Index
PV= Present Value
NPV= Net Present Value
What is a Good profitability index?
- If the profitability index is greater than 1, it is a good profitability index. The investment will be profitable. The higher the profitability index, the more profitable the investment is expected to be.
- If the profitability index is less than 1, the investment is not expected to be profitable.
Steps to Calculate Profitability Index (PI) in Excel
Let’s assume I get an offer for a new project named Project A where I want to invest my fund. The proposed initial investment is $1,000,000 at an 8% discount rate. I have created a dataset with all the given information. Now, I will determine from the profitability index whether Project A will be profitable for me or not.

Step 1: Calculate Discounted Value
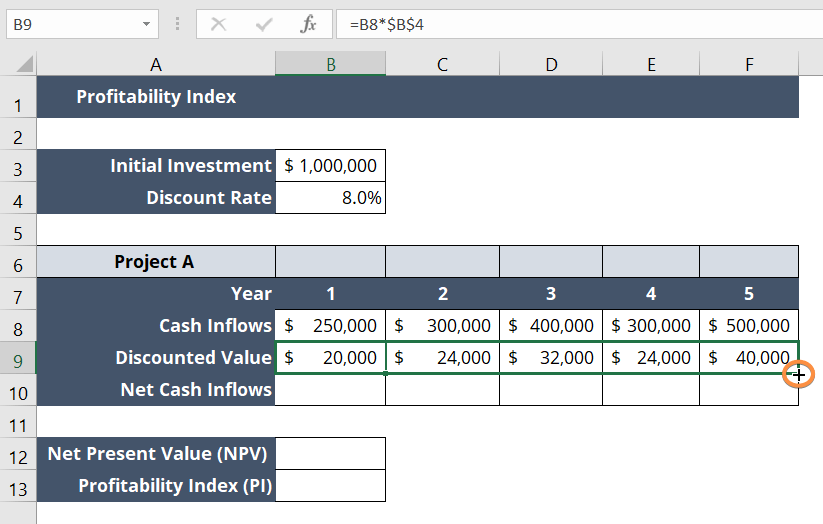
In this step, I will calculate the discounted value. To do that, I will apply a simple formula related to cash inflow and discounted rate:
= B8*$B$4If we break down the formula:
- B8 is the fixed Discount Rate of 8%.
- B4 is the Cash Inflow of Year 1. Cell B4 is locked with an absolute cell reference.
I multiplied the cash Inflow by the Discounted Rate to determine the Discounted Value.
- Select cell B9.
- Write the formula: = B8*$B$4
- Now press the ENTER key.

- Copy the formula by dragging the Fill Handle icon in the cell range B9:F9.

Step 2: Calculate Net Cash Inflows
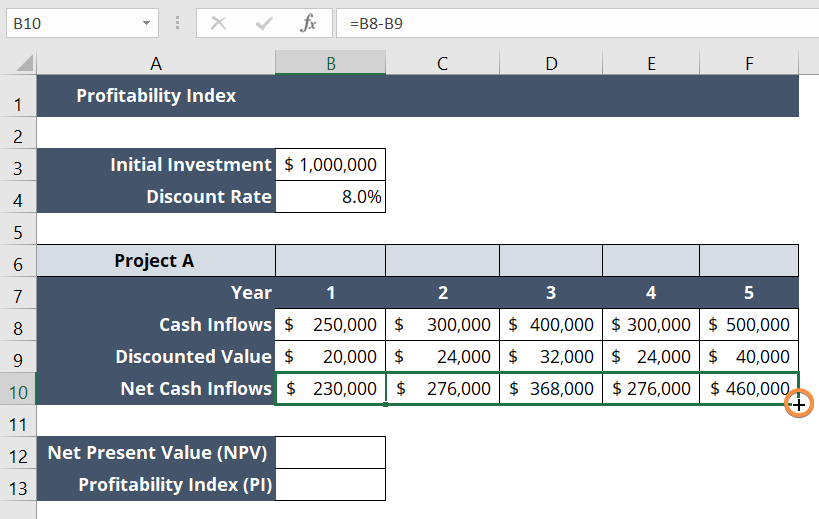
Afterward, I want to measure the net cash inflows in Excel with a formula:
= B8-B9
This formula means:
- B8 is the Cash Inflow of Year 1.
- B9 is the Discounted Value of Year 1.
In this step, I subtracted the Discounted Value from the Cash Inflow of the same period to determine the Net Cash Value of a particular period. Now, follow these steps below:
- In cell B10, type the following formula: = B8-B9
- Hit ENTER.

- Now drag the Fill Handle icon from cell B10 to F10 to copy the formula there.

Step 3: Calculate Net Present Value (NPV)
To calculate the net present value, I will apply a formula with the NPV function in Excel:
= NPV(B4,B10:F10)+B3
Here,
- B4 is the Discount Rate.
- B10:F10 is the Net Cash Inflows from Year 1 to Year 5.
- B3 is the Initial Investment.
Here, you can use the NPV function for calculating the net present value.
- Select a blank cell.
- Now type the formula: = NPV(B4,B10:F10)+B3
- Then press the ENTER key.
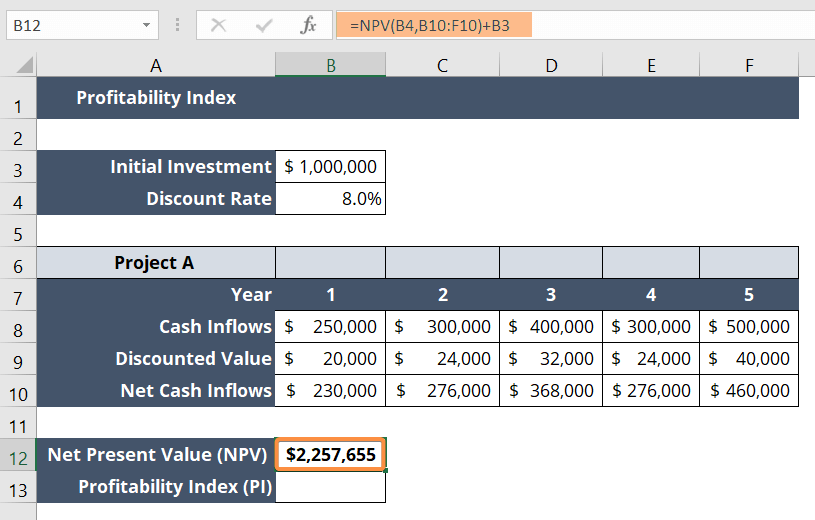
Note: The initial investment is one kind of outflow of cash. That’s why the input of the initial investment in cell B3 is – $1,000,000. Since cell B3 is in the currency format, it does not show the negative sign (-).
Step 4: Calculate the Profitability Index (PI)
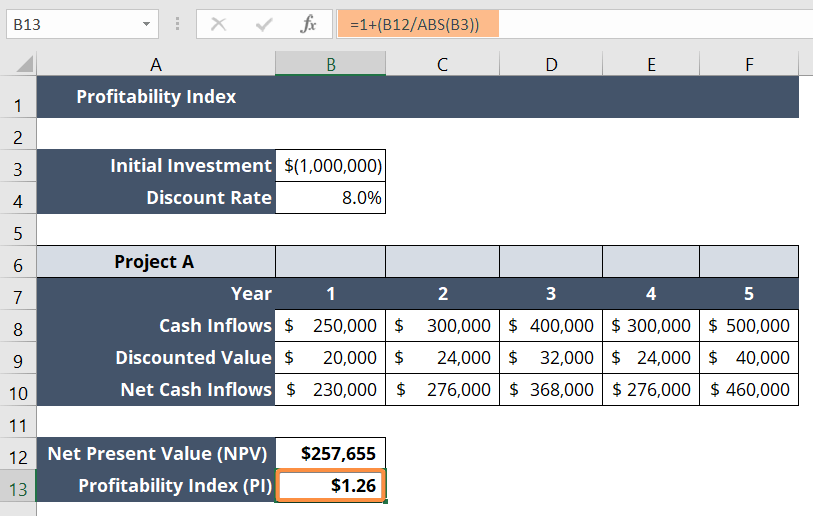
Let’s calculate the profitability index in this step before concluding the entire procedure:
= 1+(B12/ABS(B3))
This means,
- B12 is the Net Present Value (NPV).
- B3 is the Initial Investment cost.
The ABS function is used on B3, so it will return the absolute value of cell B3. It basically converted the negative value of cell B3 into a positive value.
- Select cell B13.
- After that, write the following formula: = 1+(B12/ABS(B3))
- Lastly, press the ENTER key to apply the formula.

Profitability Index Calculator
This calculator calculates the present value of the cash flows and the profitability index, based on the inputs entered by the user. The present value formula used is:
PV = -Initial Investment + CF1 / (1 + r)^1 + CF2 / (1 + r)^2 + … + CFn / (1 + r)^n
Where:
- PV: Present Value.
- Initial Investment: The initial investment made.
- CF1, CF2, …, CFn: Cash flows for year 1, year 2, …, year n.
- r: Discount Rate.
The profitability index formula used is:
Profitability Index = 1 + Present Value / Initial Investment
Download Profitability Index Excel Template
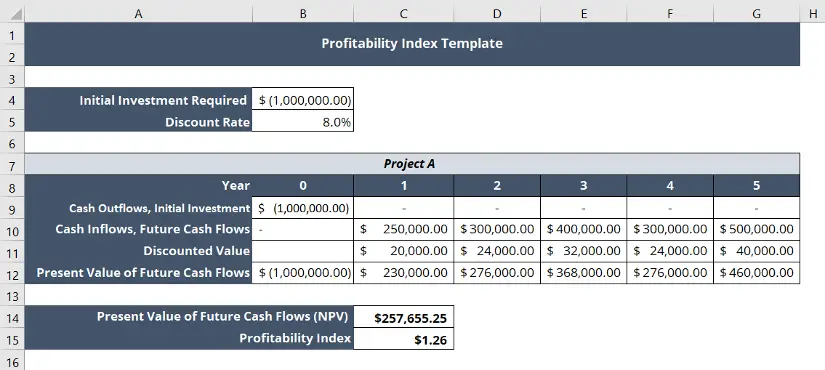
Here’s a free Excel template for you to calculate the profitability index. You can use this template to calculate the profitability index using the present value of future cash flows with respect to the initial investment.
Profitability Index (PI) Vs. Net Present Value (NPV)
Profitability index and net present value both metrics are both used to assess the potential profitability of an investment project. Both metrics are important before making an informed decision. Here are some key differences between the profitability index and net present value.
| Profitability Index (PI) | Net Present Value (NPV) |
|---|---|
| Considers the ratio of the present value of future cash flows to the initial investment. | Considers the difference between the present value of future cash flows and the initial investment. |
| Helps in ranking investment opportunities based on their relative value. | Provides an absolute value of an investment opportunity. |
| Measures how much value a project generates per unit of investment. | Measures the total value generated by an investment project. |
| Useful when comparing projects with different initial investments. | Useful when comparing projects with the same initial investment. |
| Assumes that cash flows are reinvested at the project’s rate of return. | Assumes that cash flows are reinvested at the investor’s opportunity cost of capital. |
| Commonly used in capital budgeting for evaluating investment opportunities. | Commonly used in finance for determining the value of a project or investment. |
| A relative measure of investment profitability. | The absolute measure of investment profitability. |
| Expressed as a ratio or percentage. | Expressed in dollar value. |
| A higher value indicates a more attractive investment opportunity. | A positive value indicates a profitable investment opportunity. |
Profitability Index Advantages and Disadvantages
A profitability index is a useful tool for evaluating the profitability of investment projects. But apart from having a lot of advantages, it also has some disadvantages.
Advantages
- Estimates the outcome of various scenarios by adjusting different input values. For example, changing the discount rate or changing the cash inflows.
- Helps in making informed investment decisions by comparing profitability index values. Investors can choose the most profitable investment options this way.
- Considers the value of money in the future, and then brings that money back to the present to see if it’s enough to make up for the money spent on the project.
- Indicates how efficiently a project uses invested funds.
- Can be used to determine the break-even point of a project.
- Considers the opportunity cost of investing in a particular project. It is the value of the benefits you give up by not investing in something else.
Disadvantages
- May not account for the timing of the cash flows and only considers the present value of future cash flows.
- May not be suitable for comparing projects of different sizes. Larger projects may have a lower profitability index than smaller projects, but still, the return value can be greater than the smaller projects.
- Does not take into account indirect or hidden costs.
- May not reflect actual reinvestment opportunities.
- Ignores non-economic factors such as strategic fit, market demand, social impact, etc.
- May not account for variability in cash flows and other factors which can affect project profitability.
- Uses a constant discount rate. But occasionally, the discount rate can change.
Conclusion
I hope you got an overall idea of the profitability index and how to calculate it using Microsoft Excel. If you’d like to know more about using Excel, visit our blog page anytime! Also, feel free to ask questions in the comment section if you find something confusing about this topic. Thank you!
Frequently Asked Questions
What is the profitability index with NPV?
First, divide NPV by the initial investment then sum 1 with it. Thus, you will reach the profitability index from NPV.
Is NPV the same as the profitability index?
No, NPV (Net Present Value) and profitability index are not the same financial metrics. However, they are related to each other. To calculate the profitability index, you need to calculate the NPV first.
Is IRR a profitability index?
No, the internal rate of return (IRR) is not a profitability index. You can use the IRR as a shortcut for calculating the profitability index because IRR can be used as the discount rate in the NPV formula to directly calculate the profitability index.
Is the profitability index the same as the ROI?
No, the profitability index and the return on investment (ROI) are not the same financial metrics. The profitability index compares the present value of expected cash inflows to the initial investment, while the ROI compares the gain or loss generated by the investment to the amount of money invested.
How is profitability best measured?
Profitability is best measured using a combination of financial metrics to get a comprehensive view of an organization’s financial performance. Financial indicators like gross profit margin, net profit margin, return on investment, profitability index, return on equity, etc. are great tools to measure financial performance.
How do you measure profitability in KPIs?
Profitability is commonly measured using KPIs such as return on investment (ROI), gross profit margin (GPM), net profit margin (NPM), etc. These KPIs measure the ability to generate profits relative to the amount of capital invested.
What are the 3 measures of profitability?
The 3 measures of profitability are gross profit margin (GPM), net profit margin (NPM), and return on investment (ROI).
Related Articles
- How to Calculate Total Revenue in Excel [Free Template]
- How to Find Interquartile Range (IQR) in Excel [Free Calculator]
- 2 Ways to Calculate Cumulative Frequency in Excel
- Calculate Percentage of a Number in Excel [4 Cases Explained]
- Calculate 3 Types of Profit Margin in Excel
- 2 Ways to Calculate Percentage Increase in Excel

