How to Create a Stacked Waterfall Chart in Excel
You have seen various types of charts available in Microsoft Excel. But you are not going to find the stacked waterfall chart there. In this case, you have to build one for yourself. In this article, I will guide you through creating a stacked waterfall chart in Excel.
What is a Stacked Waterfall Chart?
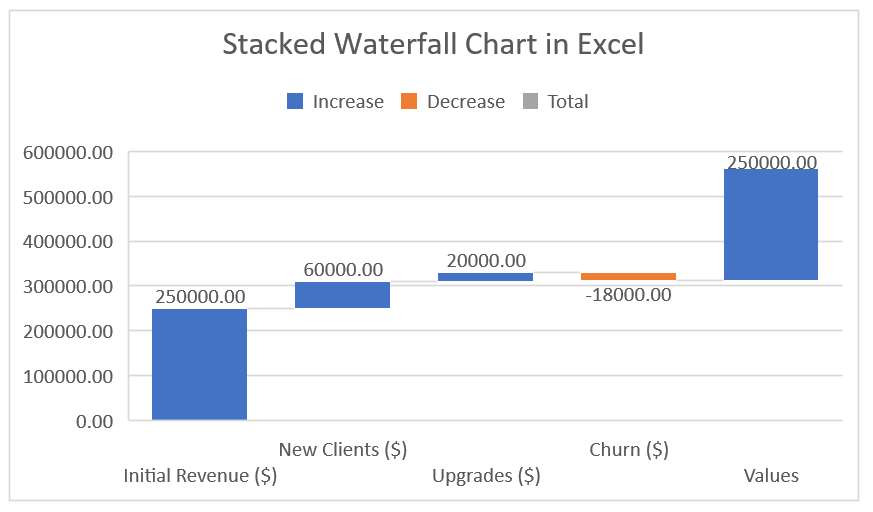
A stacked waterfall chart is usually applied to show the change in multiple datasets or if data changes over a large range. The chart helps identify trends and transitional effects by presenting data points as upward or downward bars on the chart. A regular stacked waterfall looks like this:
Introduction to the Dataset
First of all, I need a dataset for you to demonstrate this. Here’s the one that I’m going to use for this article:
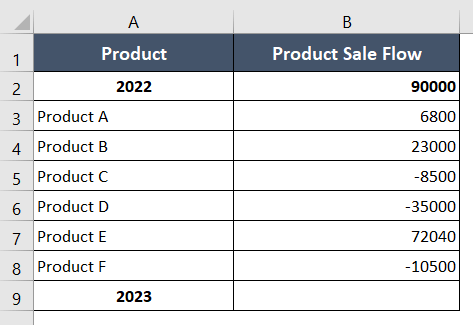
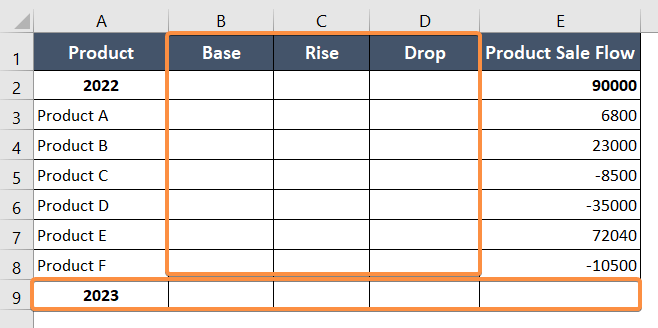
A company has six best-selling products (Product: A, B, C, D, E, and F). In 2022, the overall sale of the company was $90,000. Products C, D, and F experienced a loss, whereas Products A, B, and E made a profit. The 2023 net sale has yet to be determined in cell B9, and a stacked waterfall chart will be created for this dataset.
Easiest Way to Create the Stacked Waterfall Chart in Excel
Building a stacked waterfall chart will be a lengthy process because there is no built-in option for a stacked waterfall chart in Excel. But don’t worry! The steps are super easy to follow!
Phase 1: Reorganize the Dataset
Step_1: Right-click on any of the cells in the leftmost column.
The context menu will appear beside the cell.
Step_2: Now select Insert.
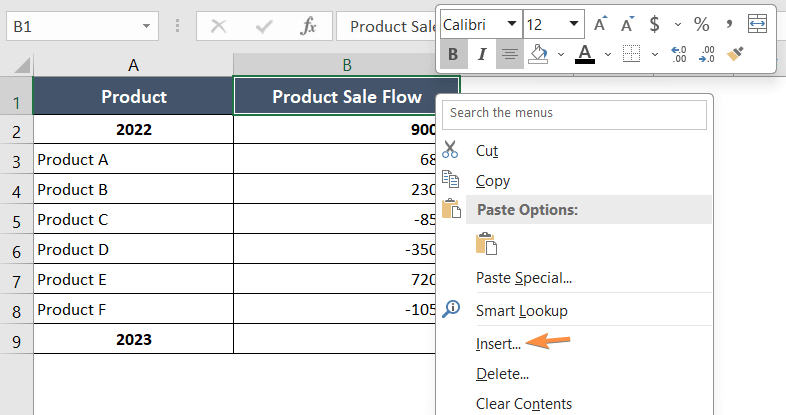
As you select the option Insert, the Insert dialog box will pop up.
Step_3: Select the entire column.
Step_4: Hit the OK button.
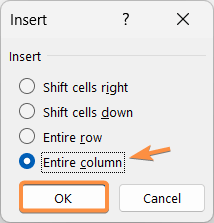
A column will be created in the middle of the two existing columns.
Step_5: This way, create three columns in the middle of the column Product and Product Sale Flow.
Columns B, C, and D are my newly made columns.
Step_6: Give the columns names: Base (column B), Rise (column C), and Drop (column D).
Step_7: Insert a row below the data table.
Step_8: Give the row a name, 2023 (cell A9).
Phase 2: Insert the Formulas
Now I will separate the rise and fall of prices for Product A to Product F in the column Rise and Drop.
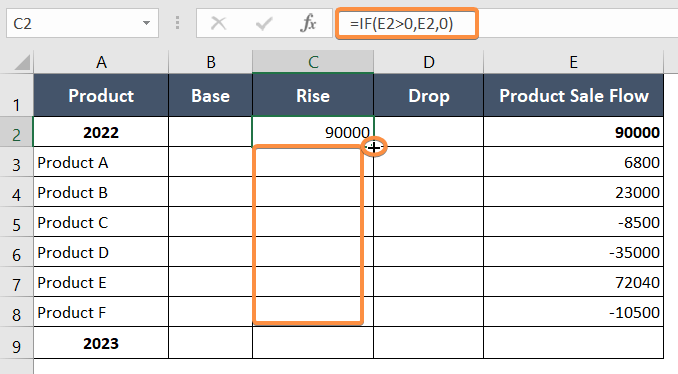
Step_1: In cell C2, type the formula:
=IF(E2>0,E2,0)Step_2: Press the ENTER key.
Step_3: Now copy the formula by dragging the Fill Handle (+ icon) from cell C2:C8.
Formula Explanation
- E2 is the Product Sale Flow in 2022, which is $90,000.
- E2>0 checks if the value in cell E2 is greater than 0.
- If the condition E2>0 is TRUE (meaning the value in cell E2 is indeed greater than 0), the formula returns the value of cell E2.
- If the condition E2>0 is FALSE (meaning the value in cell E2 is not greater than 0 or is equal to 0), the formula returns 0.
- Since $90,000 is greater than 0, the result in cell C2 was $90,000 in this instance.
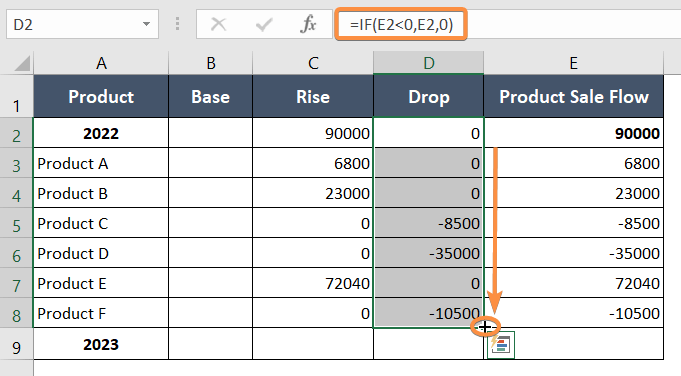
Step_4: Now in cell D2, write the formula:
=IF(E2<0,E2,0)Step_5: Press ENTER to apply the formula.
Step_6: Copy the formula by dragging the Fill Handle down from cell D2 to D8.
Formula Explanation
- E2 indicates $90,000, the Product Sale Flow in 2022.
- E2<0 checks if the value in cell E2 is less than 0.
- If E2<0 is TRUE, then the outcome will return the value from cell E2.
- If E2<0 is FALSE, that means the argument is not suitable for cell E2 and returns 0.
- Here, E2<0 or $90,000<0 is a FALSE argument, that’s why the result in cell D2 is 0.
Next, you will need to calculate the cumulative frequency to find out the base of the dataset.
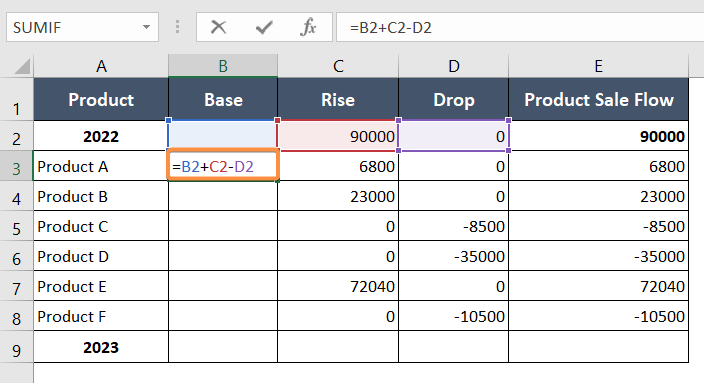
Step_7: In cell B3, type the below formula:
=B2+C2-D2Step_8: Hit ENTER.
Formula Explanation
- B2 is the Base.
- C2 is the Rise of sales.
- D2 is the Drop of sales.
Step_9: After that, drag the Fill Handle in cell B3:B9 to apply the formula.
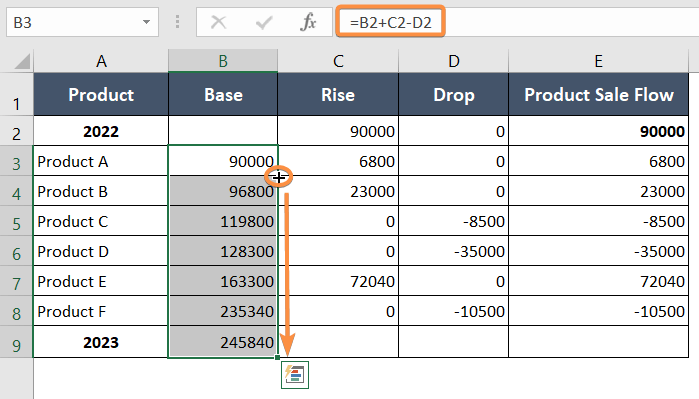
So, the base sale in 2023 was $245,840.
Phase 3: Create the Stacked Waterfall Chart
I extracted all the data from column E and organized it into three new columns (B, C, and D). So, I am only going to take cell A1:D9 into consideration as the core data table.
Step_1: Select cell A1:D9.
Step_2: Go to the Insert tab.
Step_3: From the Charts group, click on the option Insert Column or Bar Chart.
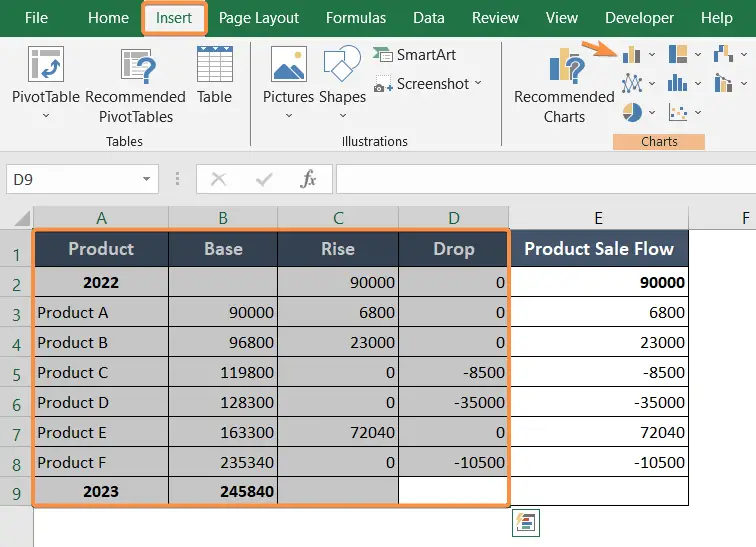
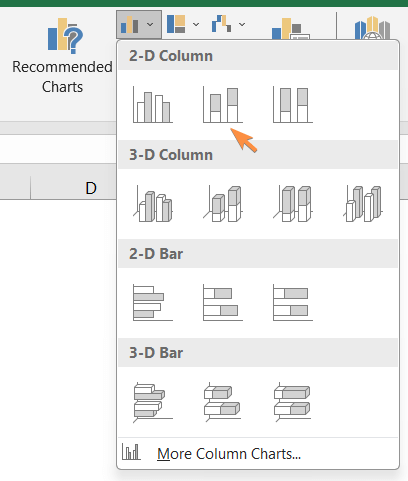
A drop-down menu of different charts will come along.
Step_4: Select a column chart style from the menu.
I picked the second option from the 2-D Column here.
As you choose the column chart, you will see a bar chart like this one:
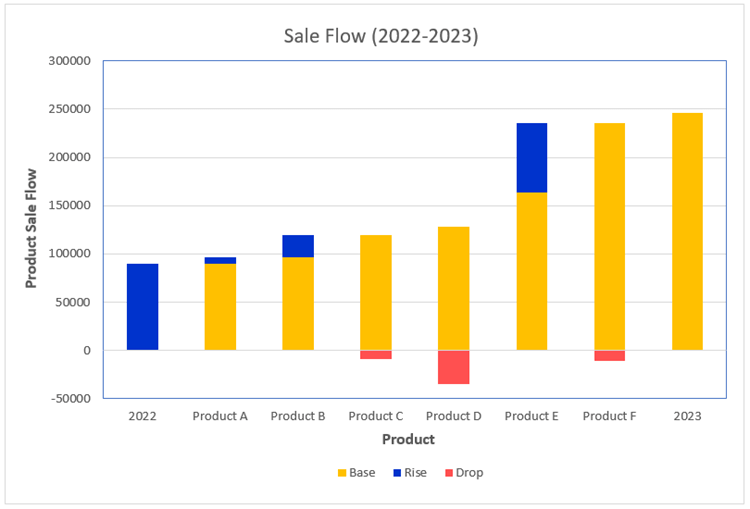
Step_5: Double-click on the bar of Base in the chart
Step_6: Select Format Data Series from the context menu.
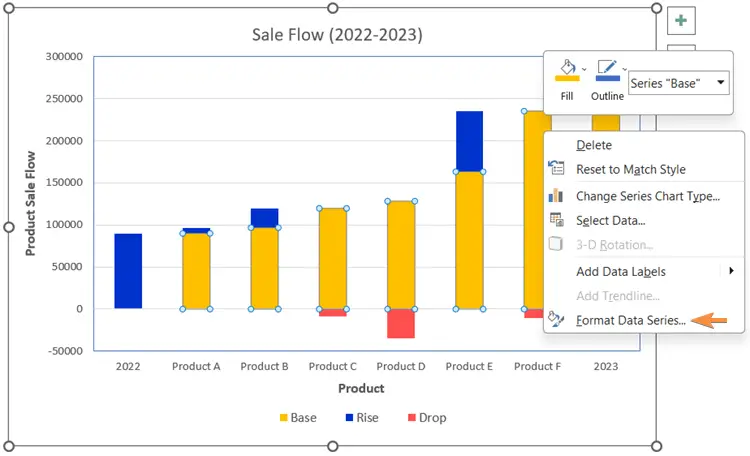
Step_7: Select the option Fill and Line.
Step_8: Select the No Fill radio button from the Fill section.
Step_9: Also, select the No Line radio button from the Border section.
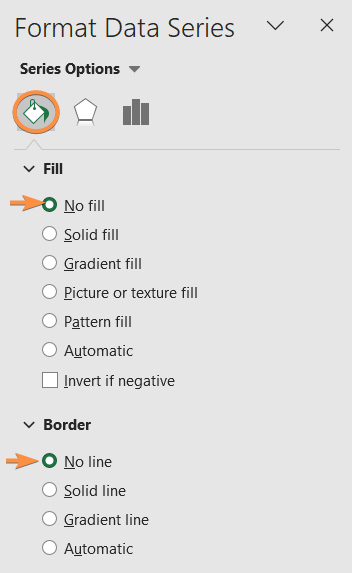
This way, you can remove the Base Sale Flow from the chart. But carefully notice that the bar for 2023 is also gone now from the chart.
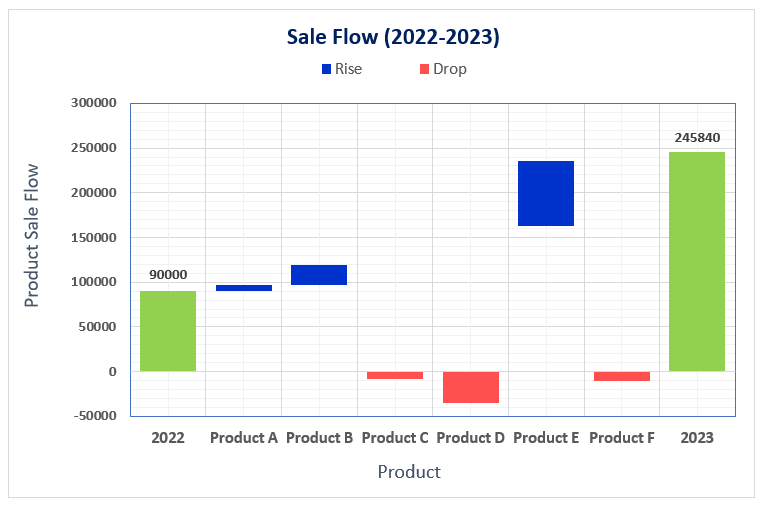
In the stacked waterfall chart, the starting and ending points need to be marked with a different color.
So, to pinpoint the bars for 2022 and 2023 as the initial and final points of the chart, follow these steps:
Step_10: Double-click on the bar for 2023.
This will select that bar only.
Step_11: Now open the context menu by right-clicking on bar 2023.
Step_12: Choose a color of your choice other than the ones the Rise and Drop bars use.
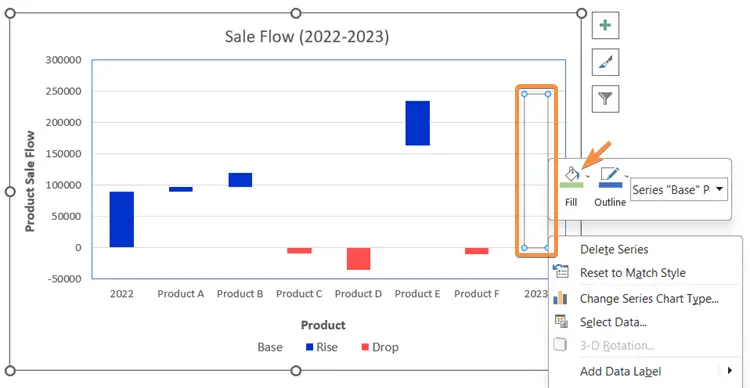
Select the same color for the bar of 2022. For this chart, I’ve chosen the lime color.
Final Result
The stacked waterfall chart is already ready. But I made a few more edits to the chart to make it more attractive. Check this out:
Things to Remember
- Adjust the color schemes, data labels, and other chart elements to make it more readable and visually appealing.
- Review your chart, make any necessary adjustments, and ensure that it effectively communicates the cumulative impact of each month’s revenue changes.
Advantages of Using Stacked Waterfall Charts
- Clarity in Data Analysis: Stacked waterfall charts provide a clear and intuitive way to analyze data, allowing viewers to easily understand how individual components contribute to a total.
- Sequential Impact: They excel at illustrating the sequential impact of positive and negative values, making them valuable for tracking changes over time or across categories.
- Highlighting Trends: Stacked waterfalls highlight trends, showing which factors are driving growth or causing declines in a data series.
- Comparative Analysis: They facilitate easy comparison between categories or time periods, aiding in identifying outliers or significant contributors.
Conclusion
In conclusion, a stacked waterfall chart in Excel is a potent visualization tool that simplifies complex data narratives. By showcasing sequential impacts and contributions, it empowers decision-makers to gain valuable insights and make informed choices. I think you found this article helpful, and now you can create a stacked waterfall chart in Excel on your own. Thanks for following our writing!
spelling error: DROPE in Phase 2: Insert the Formulas
Now I will separate the rise and fall of prices for Product A to Product F in the column Rise and Drope.
Also, numeric confusion with commas in
So, the base sale in 2023 was $2,45,840.00. Maybe due to other numeric standard in mind . . .
DB
Fixed. Thanks for picking that up!