How to Graph an Equation in Excel without Data (2 Cases)
Case #1: Graph a Linear Equation in Excel without Data
The linear equation is the most common equation for plotting a graph or chart.
Formula of Linear Equation
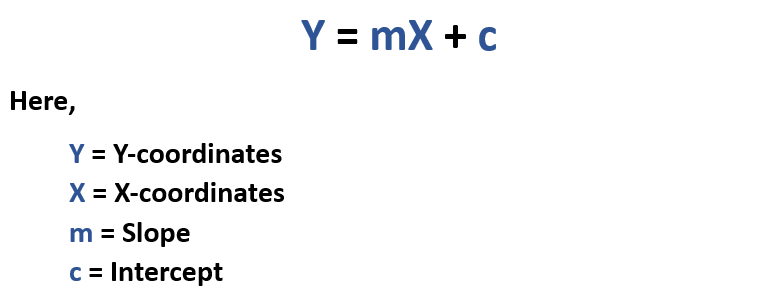
I will describe both graphing the linear equation and the quadratic equation. Let me show you the technique of graphing the linear equation first.
Usage Guide
Step_1: Enter the letters m, x, c, and y as the column headers in cells A1 to D1.

Step_2: Then type the following equation in cell D2.
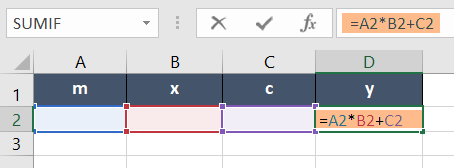
=A2*B2 + C2Step_3: Then press ENTER.
Step_4: Take the cursor to the right-bottom corner of cell D2 and drag down the Fill Handle icon from cell D2 to D10.
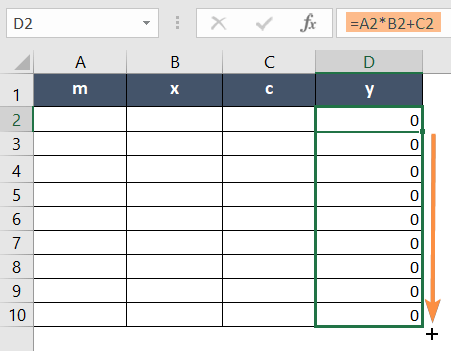
Step_5: Now press the CTRL key and select cells B2:B10 and D2:D10.
Note: Do not take your finger off the CTRL key while selecting the cell ranges from different columns.
Step_6: Go to the Insert tab.
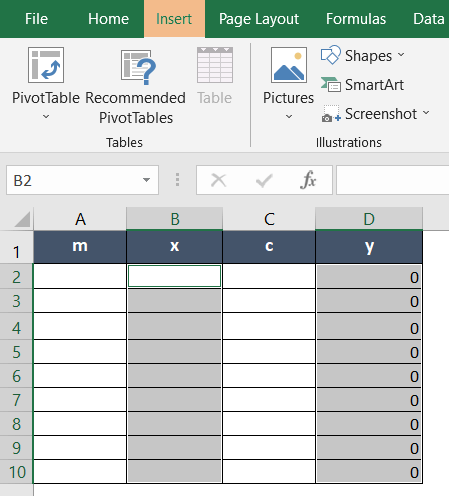
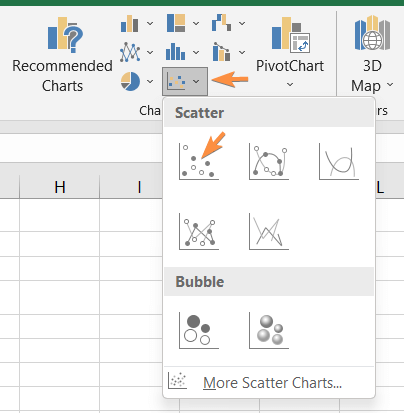
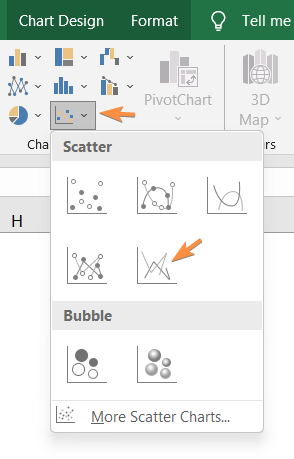
Step_7: From the Charts group, select the Scatter Chart.
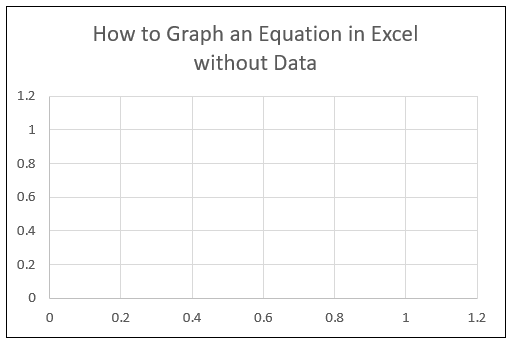
An empty box of scatter plot will show up on the screen. But don’t worry. The chart will start to show results according to the linear equation as soon as you start to enter values in the dataset.
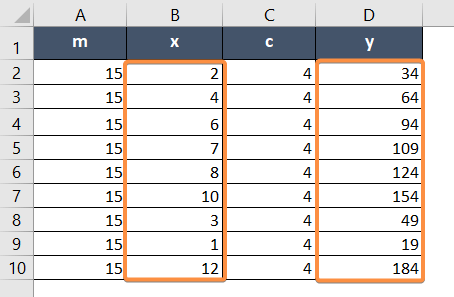
Step_8: Enter the values for m and c in columns A and C, respectively.
For example, I have given values for m = 15 and c = 4 in the entire data table. The values in your situation can be different.

Step_9: In column B, enter the values for X-coordinates.
Notice that as I started to enter the values for X-coordinates in column B, the values for Y-coordinates automatically appeared in column D. It is because the equation of the straight line has already been inserted in the cells of column D.
Final Result >
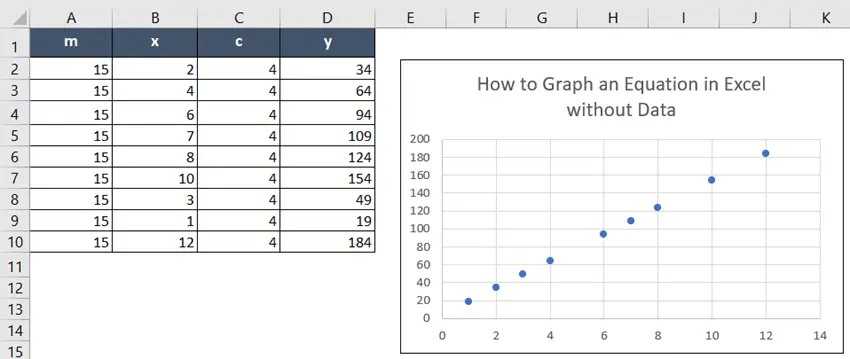
I received a graph like the image above. You can change the values and explore the variation in results.
Case #2: Graph a Quadratic Equation in Excel without Data
In Case #1, I portrayed an example of graphing a linear equation without dataset input. The same concept can be applied to graphing other types of equations as well. This time, I will be showing you the same process for a quadratic equation.
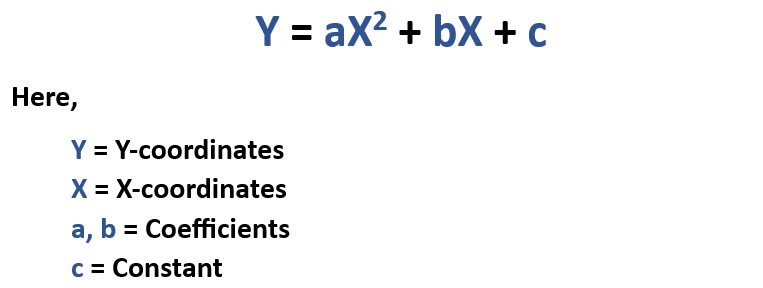
The formula of Quadratic Equation:
Usage Guide
Step_1: First, create column headers named a, b, c, x, and y in the cell range A1:E1.

Step_2: Now type the following equation in cell E2.
=A2*D2*D2+B2*D2+C2
Step_3: Hit ENTER.
Step_4: Drag down the Fill Handle icon from cell E2 to E16.
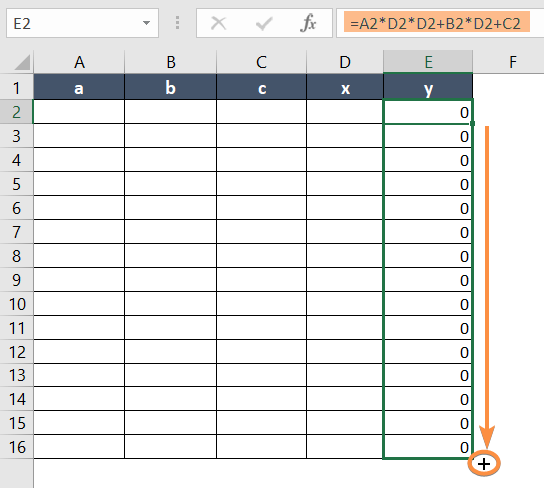
This will copy the formula in the selected cell range. You can expand your cell range selection.
Step_5: Now select the entire dataset, A2:E16.
Step_6: Next, go to the Insert tab.
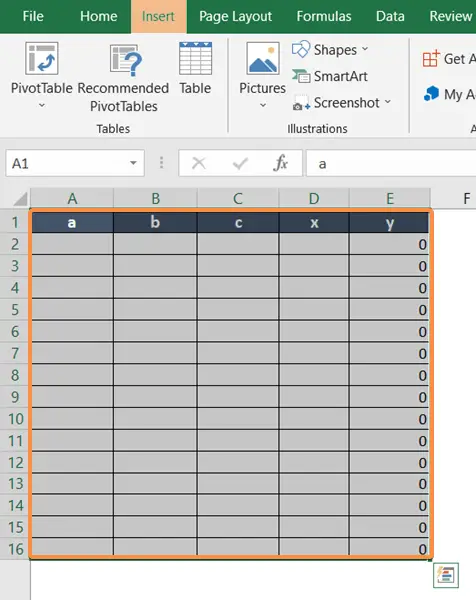
Step_7: Insert values for a in column A.
Let’s say, I have input 1 for the value of a in all cells of column A.
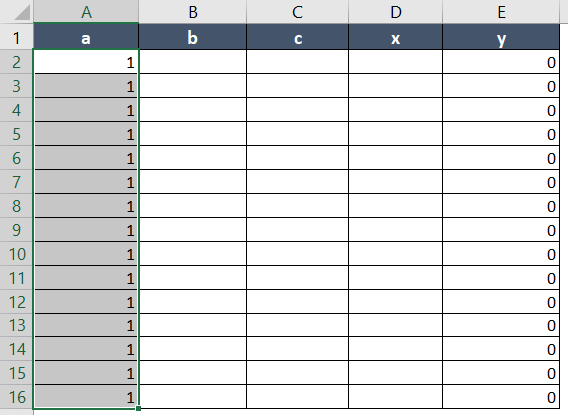
Step_8: Enter the values for b in column B.
I entered 2 in the cell range B2:B16.
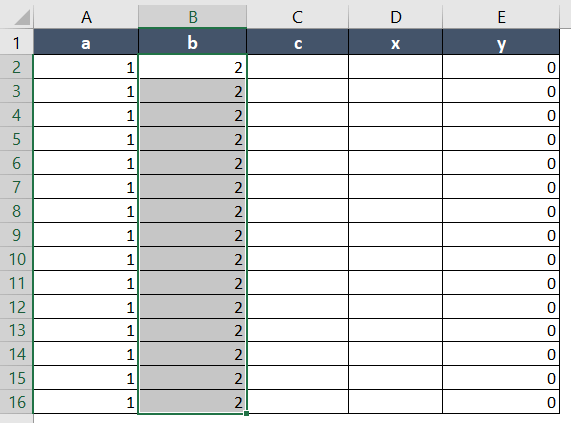
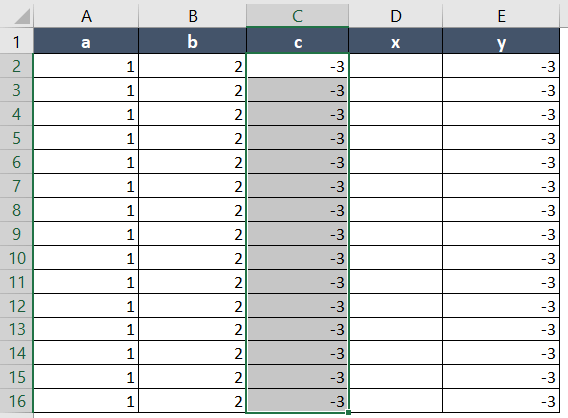
Step_9: Then insert the values for c in column C.
I used the value -3 for c here. As I entered the values for c in column C, the values of y immediately changed.
Step_10: Then insert the values for x in column D.
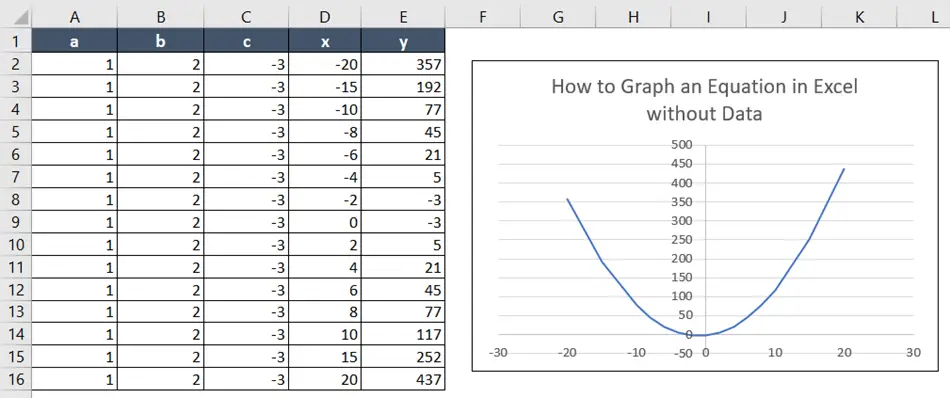
In cell range D2:D16, I inserted values from -20 to 20.
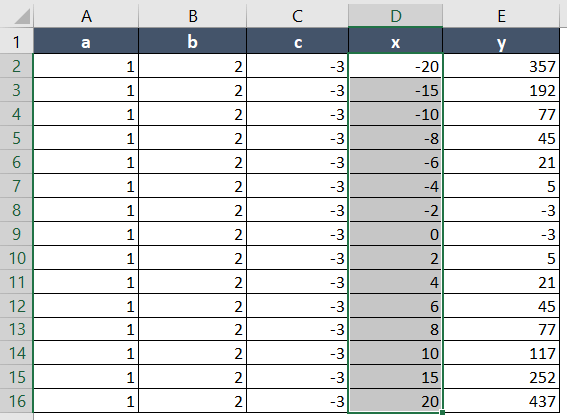
The values of Y-coordinates instantly appeared in column E as I entered the values of X-coordinates (column D).
Step_11: Now select the cell range D2:E16.
Step_12: Next, go to the Insert tab.
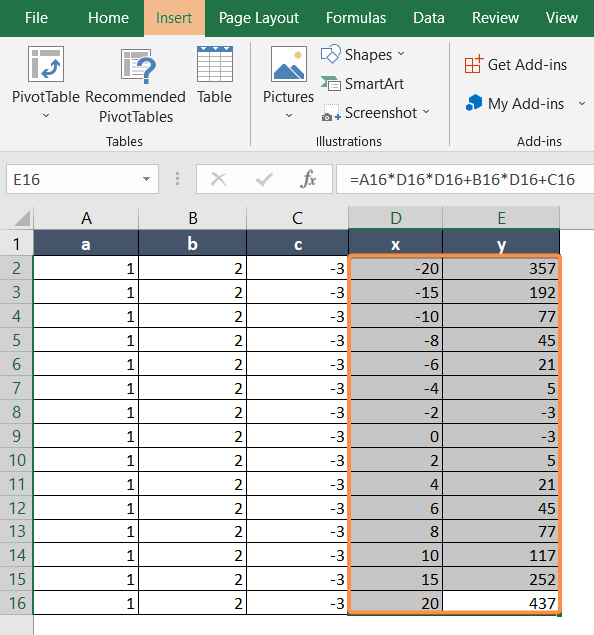
Step_13: From the Charts group, select a chart type.
Here, I have chosen the Scatter Plot with Straight Lines.
Final Result >
The quadratic graph like the one below was created from my dataset:
Conclusion
I have shown the two most common cases of graphing equations in Excel without data input. I hope you get your desired help from this article. Feel free to ask anything regarding this topic and write in the comment box below. Happy Excelling!