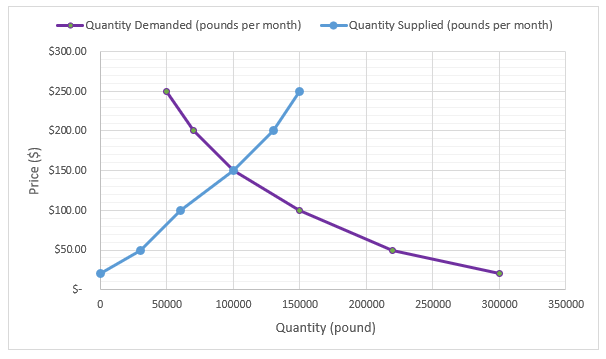
How to Make a Supply and Demand Graph in Excel
A supply and demand graph is a visual representation of the relationship between the quantity of a product or service that suppliers are willing to offer and the quantity that consumers are willing to purchase at various price levels. In this article, I will guide you through the step-by-step process of making a supply and…