Search Results for: remove

Modify option to edit the formula in the Excel Pivot Table calculated field

How to Edit Pivot Table Calculated Field [Step-by-Step]

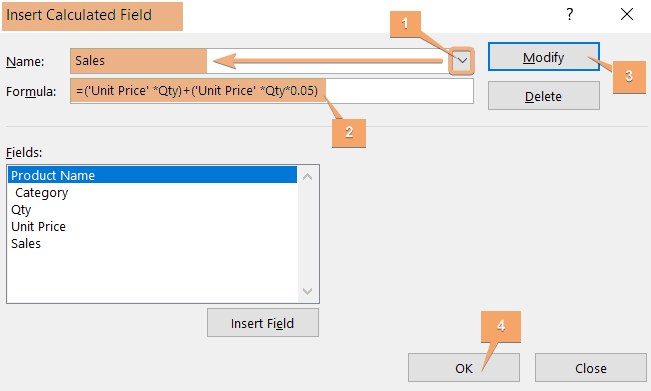
To edit Pivot Table Calculated Fields, go through the steps below: Click any cell in the Pivot Table to access PivotTable Tools. Navigate to the Analyze tab. Access the Fields, Items & Sets dropdown > Calculated Field option. Select the existing calculated field in the Insert Calculated Field dialog box. Modify the formula in the…

Displaying error message of "Cannot group that selection" in Excel Pivot Table

How to Fix “Cannot group that selection” in Excel Pivot Table

In a Pivot Table, you will need to group selections in Excel. While trying to group a specific selection in a Pivot Table, sometimes you will encounter an error message “Cannot group that selection”. In this article, I have 4 ways to fix this error. Let’s explore how to solve this issue of Pivot Table…

Grouping dialog box to group Pivot Table by month in Excel

How to Group Pivot Table by Month in Excel [Step-by-Step]

Pivot Table in Excel is a powerful tool to organize and summarize data by date and month. This functionality allows users to aggregate and summarize data based on monthly intervals, providing a clear and concise overview of trends and patterns over time. By grouping data into monthly segments, users can easily identify seasonality, track performance,…

Excel Pivot Table Sort by sum

How to Sort Pivot Table by Sum in Excel [2 Cases]

By sorting the Pivot Table by sum in Excel in descending or ascending order, users can quickly identify the highest or lowest contributing factors within their dataset. This capability is essential for gaining insights into trends, patterns, and key metrics, making it a valuable asset for data analysis and decision-making. In this article, I will…

M language in power query

Getting Started with M Language in Power Query

Power Query, a powerful data transformation tool embedded in Microsoft Excel and other Microsoft products, utilizes a specialized language known as “M.” M is designed for manipulating and transforming data, offering users a robust set of functions and capabilities. If you’re looking to dive into the world of M language in Power Query, this guide…

IF Statements in Power Query

IF Statements in Power Query [3 Examples]

In Power Query, the IF statement is a conditional logic tool that allows you to make decisions based on specified conditions. This feature enhances data transformation capabilities, enabling dynamic data processing and filtering within the Power Query Editor. IF statements enable dynamic decision-making in creating new columns. Conditions can be tailored to specific criteria for…

Report Layout options to change the Pivot Table layout in Excel

How to Change Pivot Table Layout in Excel [5 Best Methods]

Excel’s PivotTable feature is a powerful tool for data analysis and reporting, allowing users to summarize and analyze large datasets with ease. One of the key advantages of PivotTables is their flexibility in presenting data. In this article, we’ll explore how to change the Pivot Table layout in Excel, giving you the ability to tailor…

Display the Pivot Table Row Labels in side-by-side columns

2 Ways to Arrange Pivot Table Columns Side by Side in Excel

To arrange the Pivot Table columns side by side, go through the steps below: Firstly, hit any cell in the Pivot Table to access the Design tab. Then, click on the dropdown of Change Report Layout. Lastly, select Show in Tabular Form option. By following these steps, you can change the row labels layout in…

Conditional Formatting options to apply it in the Pivot Table

How to Apply Conditional Formatting in Pivot Table [2 Ways]

In a pivot table, you will need to highlight certain data by applying some conditions. Conditional formatting can be used to change the look of some particular cells depending on the conditions. In this article, I have explained how to use conditional formatting in pivot tables in Excel using two methods. In addition, I have…