How to Apply Conditional Formatting in Pivot Table [2 Ways]
In a pivot table, you will need to highlight certain data by applying some conditions. Conditional formatting can be used to change the look of some particular cells depending on the conditions. In this article, I have explained how to use conditional formatting in pivot tables in Excel using two methods. In addition, I have also added some other formatting approaches in conditional formatting in the pivot table. Let’s get started.
What is Conditional Formatting?
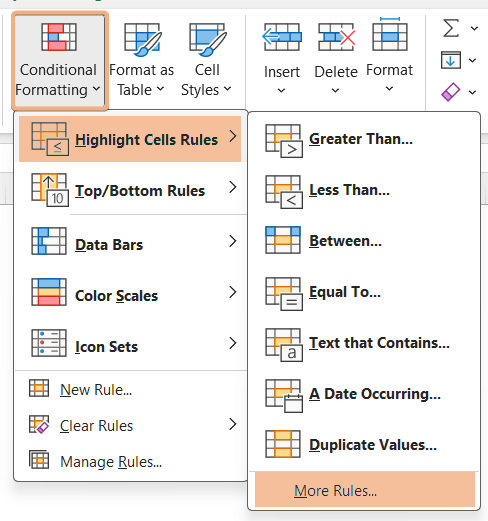
Conditional Formatting is a tool in Excel to change the appearance of cells or a range of cells applying a condition. You can find it under the Styles group. You will select the way you want to apply conditional formatting.
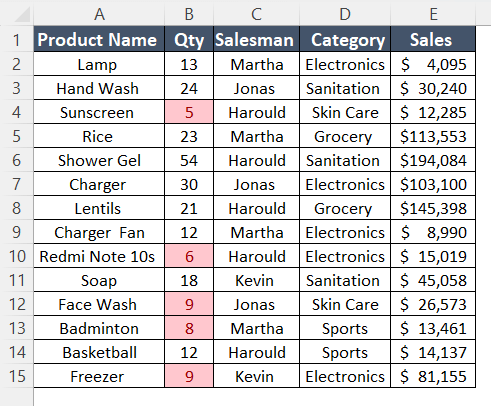
For example, you have a dataset of some products with details. You want to highlight the cells of the quantity column that have numbers less than 10.
I applied conditional formatting to cells B2:B15. Hence I got the highlighted cells.
How to Apply Conditional Formatting in Pivot Table?
To apply conditional formatting in a Pivot Table, insert a Pivot Table first. Here, I want to highlight cells in the sum of quantity that are less than 10.
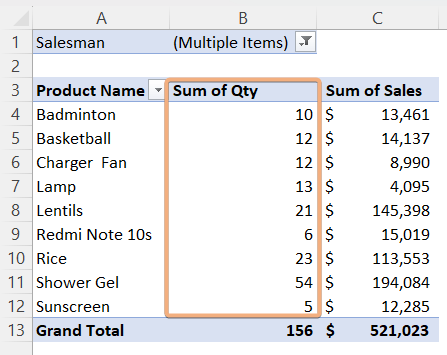
After inserting the Pivot Table, follow the steps to apply the conditional formatting in the Pivot Table:
- Select the cells.
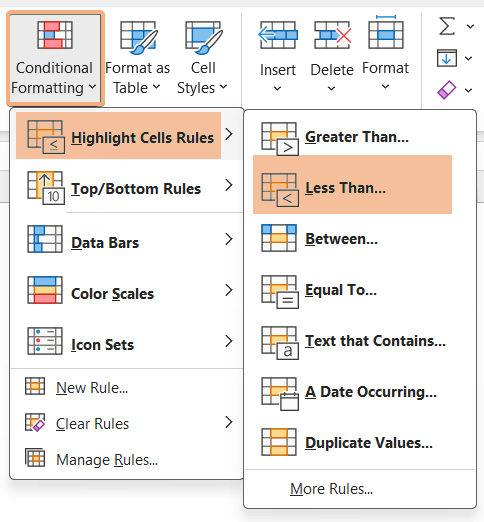
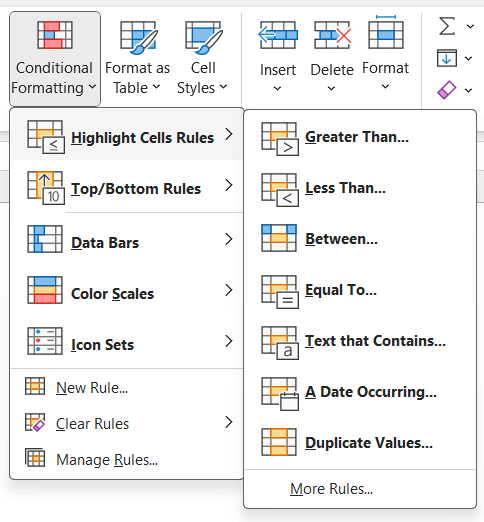
- Then, go to Home tab> Conditional Formatting dropdown.
- Choose the conditional formatting type.
Here, I chose Highlight Cells Rules command > Less Than option.

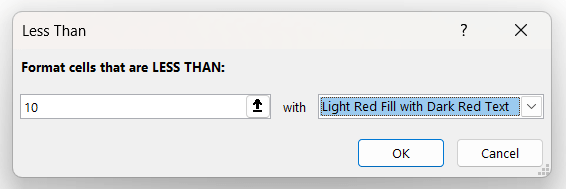
It will open the Less Than dialog box. - Insert the number you want to put and the cell color. Then, click OK.

Custom Format in Conditional Formatting
To custom format, click on the dropdown of the right-sided box inserting the color type. Next, select the Custom Format. Hence, it will lead to the Format Cells dialog box. Now, format Number, Font, Border, and Fill.
Here, I have changed the fill color only. It will change the color of the highlighted cells with a custom format.
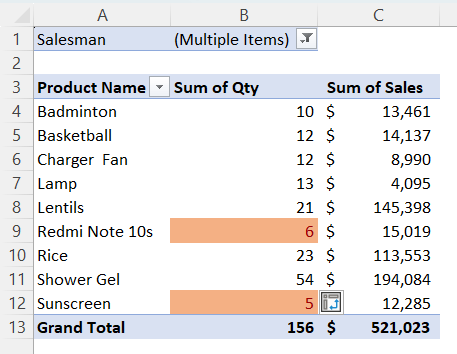
Using Formatting Options Icon in Conditional Formatting
After applying conditional formatting, you will find the formatting options icon at the end of the selected data range.
![]()
Now, apply the formatting rule by using this icon. There will be three options. Select the suitable option.
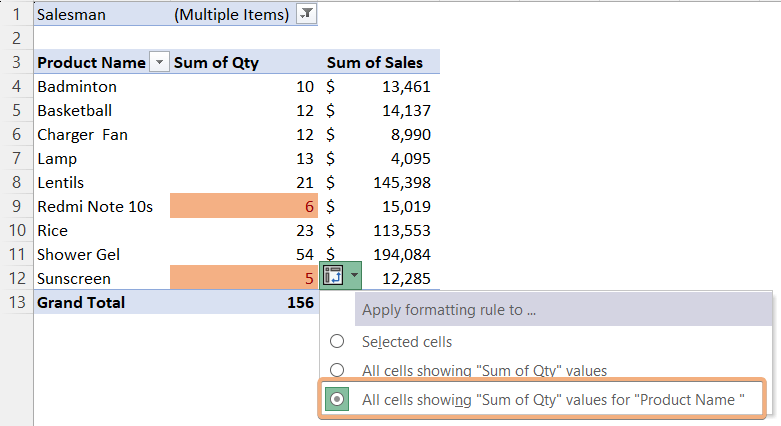
This step will help you to keep the conditional formatting even when you add more data to the Pivot Table.
Check If Conditional Formatting is Updated with Data in the Pivot Table
To check the result, I will change the filter type here from multiple items to all. It will add more data to the Pivot Table.

Now, click OK. You will see the new highlighted cells in that column.
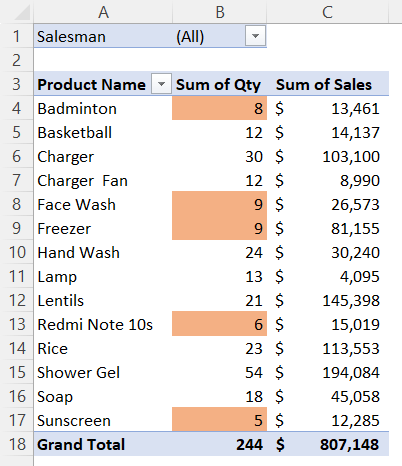
Conditional Formatting Pivot Table with Manage Rules
To use Manage Rules in Conditional Formatting tool in the Pivot Table, go through the procedure below:
- Select the cells.
- Go to Home tab > Conditional Formatting dropdown.
- Select a formatting type and apply the rule first.
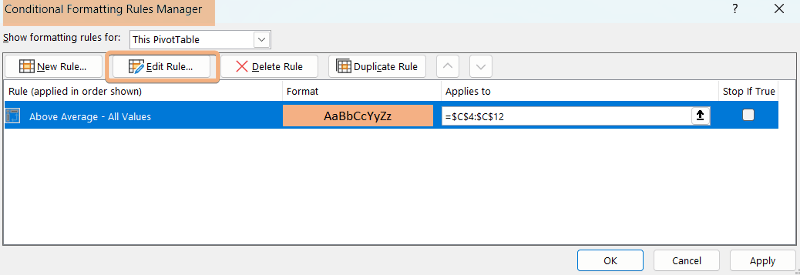
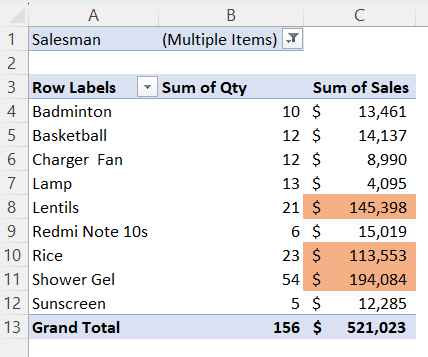
Here, I applied the Top/Bottom Rule command > Above Average option in the Sales field. - Then, again navigate to Conditional Formatting dropdown > Manage Rules option.
- Select Edit Rules command in the Conditional Formatting Rules Manager dialog box.

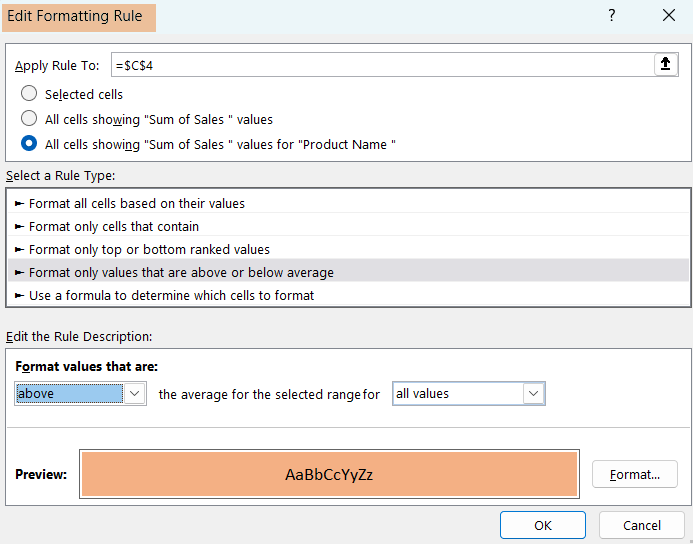
- Now, choose the third option in the Edit Formatting Rule and click OK.

By doing these steps, it will keep the conditional formatting even when you add data to the dataset.
How Clear Conditional Formatting from Pivot Table?
If you think, you don’t need this conditional formatting in the Pivot Table. You can clear the conditional formatting in the selected cells, the entire sheet, or from the Pivot Table with only one click.
Just follow these steps:
- Go to Home tab > Conditional Formatting dropdown > Clear Rules command.
- Select from where you want to apply Clear Rules.
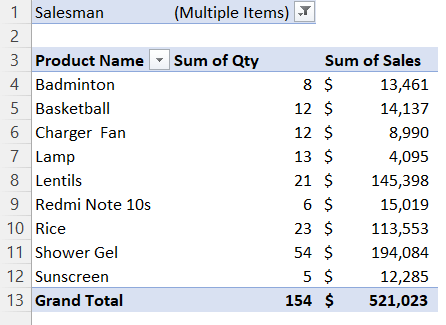
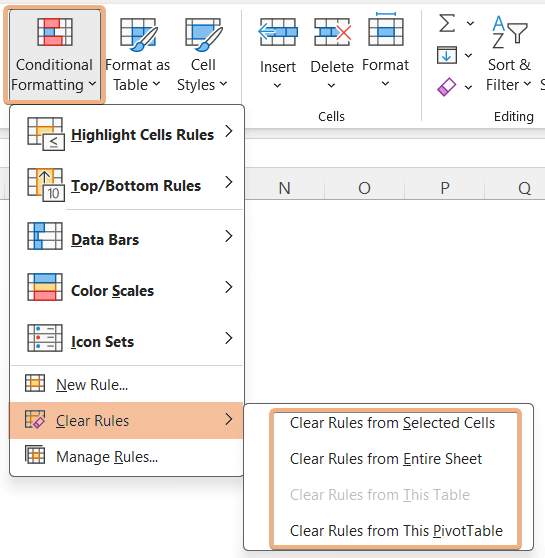 Here, I have selected “Clear Rules from This PivotTable“. I have removed the rules from the Pivot Table.
How to Apply Conditional Formatting in Pivot Table for Blank Cells?
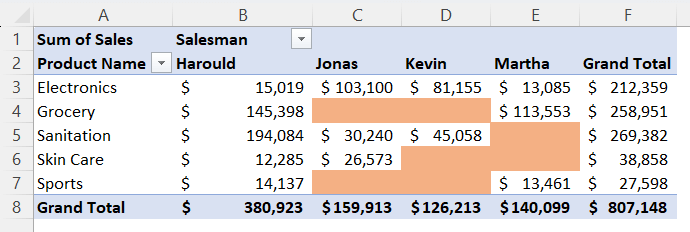
To apply conditional formatting in a Pivot Table to highlight blank cells, you need to follow these steps:
- Select the data range in a Pivot Table.
- Go to Home tab > Conditional Formatting dropdown.
- Then, select Highlight Cell Rules command.
- Next, choose More Rules option.

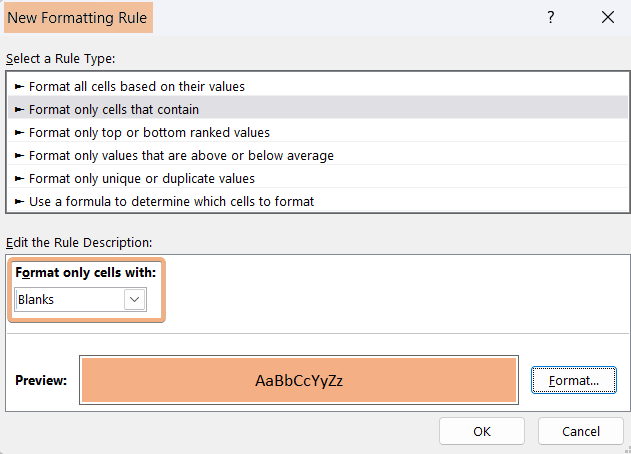
- Select Blanks under “Format only cells with:” in the New Formatting Rule dialog box and click OK.

Here is the highlighted result of blank cells in a Pivot Table.
Conclusion
In this article, I have added 2 methods to apply conditional formatting in Pivot Tables in Excel. Besides, I have included how to custom format and use the formatting options icon. Moreover, you can also check if conditional formatting is updated with new data. You will also learn to clear formatting. You will learn to highlight blank cells using conditional formatting. So, I hope you won’t face any issues regarding the conditional formatting Pivot Table in Excel.
Frequently Asked Questions
How do I keep conditional formatting in a Pivot Table after refresh?
To keep conditional formatting in a Pivot Table after a refresh in Excel, follow these steps:
- Go to the source data that’s used to create the Pivot Table.
- Apply the same conditional formatting to the source data that you’ve used in the Pivot Table.
- After applying the formatting, refresh the Pivot Table to test.
By following these steps, the conditional formatting will be preserved even after refreshing the Pivot Table, ensuring that your data remains visually formatted as intended.
How do I apply conditional formatting to an entire column?
To apply conditional formatting to an entire column in Excel, follow these steps:
- Click on the column letter at the top of the column to select the entire column. For example, if you want to format column A, click on the letter “A.”
- Go to the Home tab on the Excel ribbon.
- In the Styles group, click on Conditional Formatting dropdown.
- Choose the type of conditional formatting you want to apply, such as Color Scales, Data Bars, Icon Sets, or New Rule for custom formatting.
- Set the formatting criteria and formatting options based on your preferences.
- Click OK to apply the conditional formatting to the entire selected column.
This will format the entire column based on the specified conditions, making it easy to visually analyze your data.
