2 Ways to Make Residual Plot in Excel
What is a Residual Plot?
The Residual Plot is the display of the distance between a selected set of data points and their regression line shown on a scatter plot. In simple language, a Residual Plot is the difference between the actual values and the expected values.
Introduction to the Dataset
First, get familiar with the dataset in this article. I have built a data table that shows how many cars are sold based on the number of ads that have been published over the past 10 weeks.
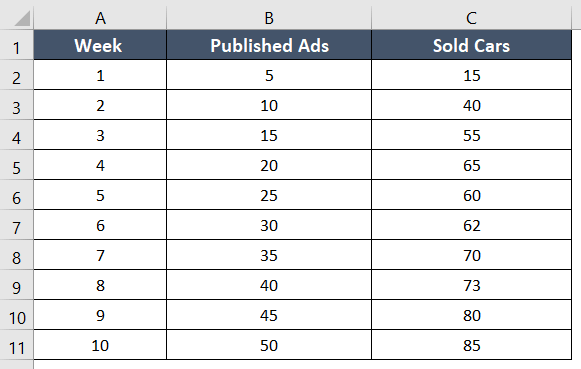
The number of cars sold is dependent on the number of advertisements that are published. So, according to the equation of the straight line, the ads are independent variables (X) and the cars are dependent variables (Y).
Easiest Way to Make a Residual Plot in Excel
To use this method, you first have to determine the residual values. After that, creating the residual plot is simple.
Usage Guide
Step_1: Select the cell range B1:C11.
These are the X and Y values.
Step_2: Go to the Insert tab.

Step_3: Select a Scatter Plot from the Charts group.
I picked up the first Scatter Plot from the Scatter drop-down menu.

Step_4: Now go to Chart Elements>Trendline>More Options.
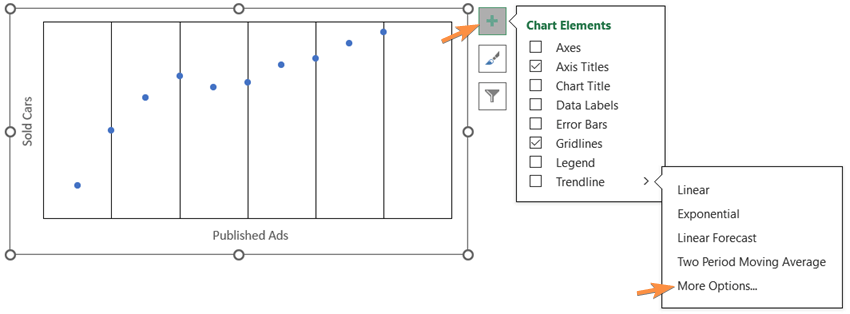
The Format Trendline task pane will appear on the right side of the worksheet.
Step_5: Select the option Display Equation on Chart.
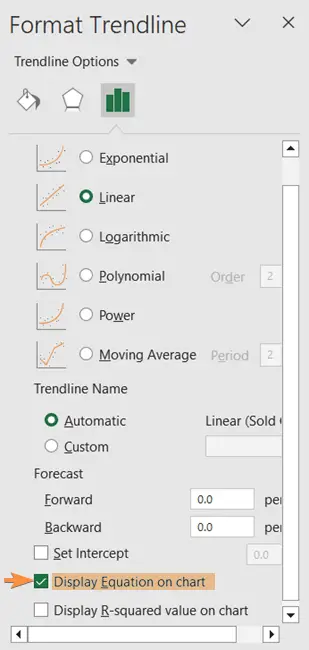
Instantly, the equation will appear beside the trendline of the chart.

Step_6: Next, create a new column named Expected Values.
The location of the new column in my data table is column D.
Step_7: Copy the equation from the chart except for the letter Y.
=1.2327x + 26.6
Step_8: Paste the formula in cell D2, delete the X, and then insert B2 in the formula.
=1.2327B2 + 26.6
Formula Explanation
The equation of a linear trendline is: y= mx + c
- y represents the Y-coordinates
- 1.2327 is the value of m (slope)
- B2 is the value of X-coordinates
- 26.6 is the value of c (vertical intercept)
The values of the X variable are added to the formula this way.
Step_9: Then take the cursor in the right bottom corner and drag the Fill Handle icon from cell D2:D11.
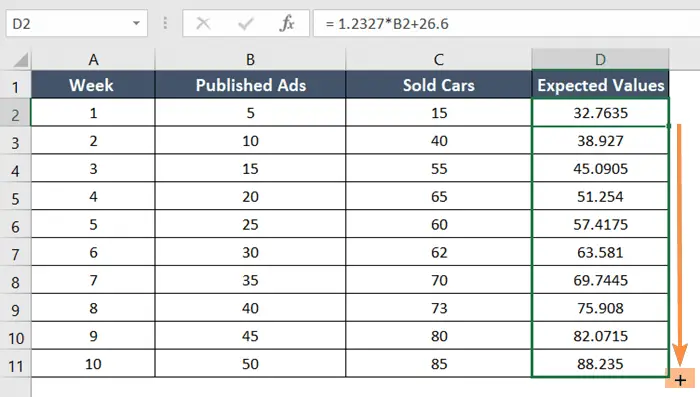
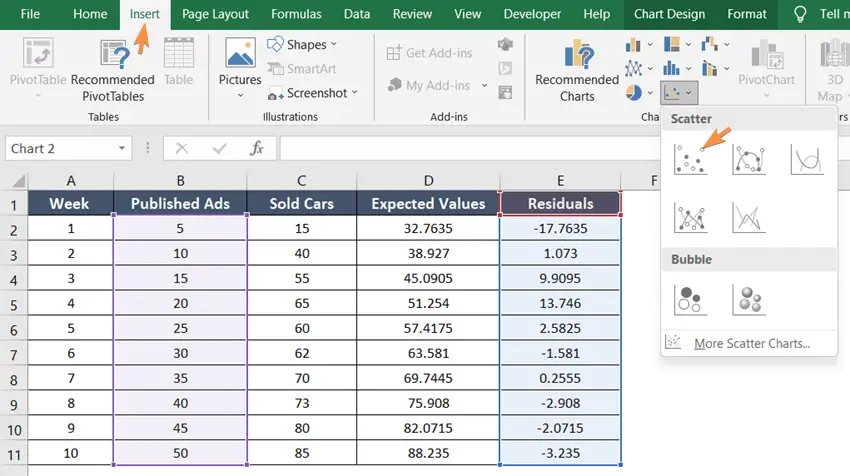
Step_10: Add another column named Residuals in the location column E.
Step_11: Type this formula in cell E2:
=C2-D2
Formula Explanation
- C2 is the actual value of the Y variable.
- D2 is the expected value of the X variable.
Step_12: Press the ENTER key.
Step_13: Drag the Fill Handle icon in the cell range E2:E11.

Step_14: Now select cell range B1:B11, press CTRL, and select cell E1:E11.
Step_15: Go to the Insert tab > Charts group > Scatter Plot.
Final Result >
A residual plot like the one I have below will appear on your Excel sheet:
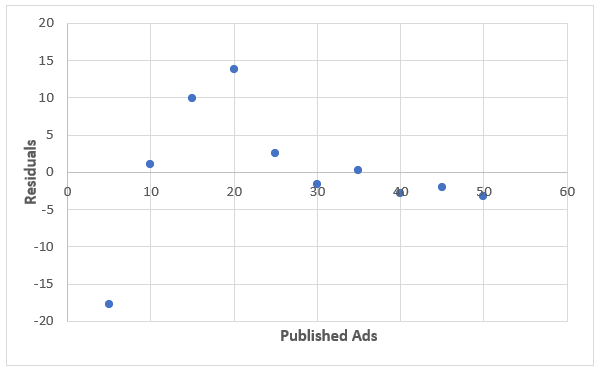
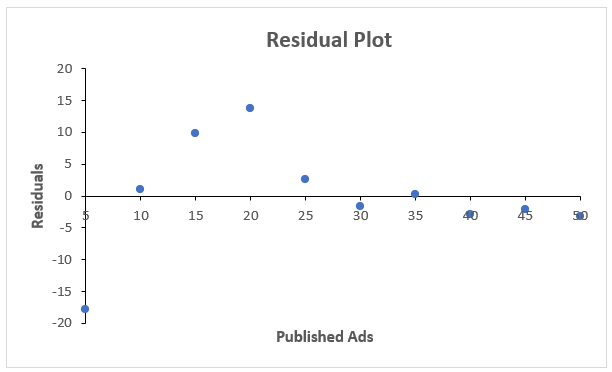
After a few modifications, I gave the residual plot the following final appearance:
Alternative Way: Make a Residual Plot in Excel with Data Analysis ToolPak
Before showing you this technique, a gentle reminder is that if your Excel doesn’t already have the Data Analysis command, click here and follow the steps.
Usage Guide
Step_1: Open the worksheet that has the data table.
Step_2: Go to the Data tab.
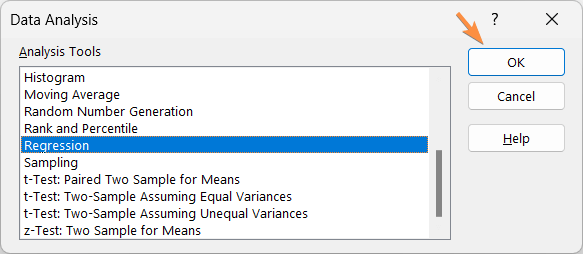
Step_3: Click on the Data Analysis command from the Analysis group.
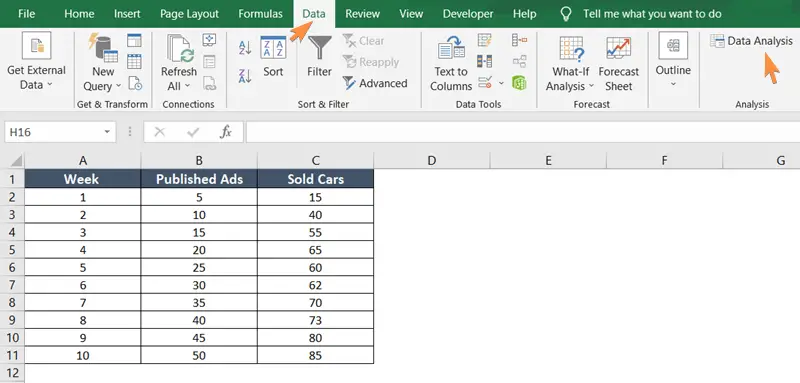
The Data Analysis dialog box will pop up on the worksheet.
Step_4: Select Regression from the Analysis Tools list.
Step_5: Hit the OK button.
After that, the Regression window will appear on the Excel sheet.
Step_6: Inside the Input Y Range box, insert the cell range C2:C11.
Step_7: Inside the Input X Range box, insert the cell range B2:B11.
Tip: If you have the data labels, select Labels.
Step_8: Select an empty cell, cell A14 in the Output Range.
Step_9: Select Residuals.
Step_10: Select Residual Plots.
Step_11: Hit the OK button.

Final Result >
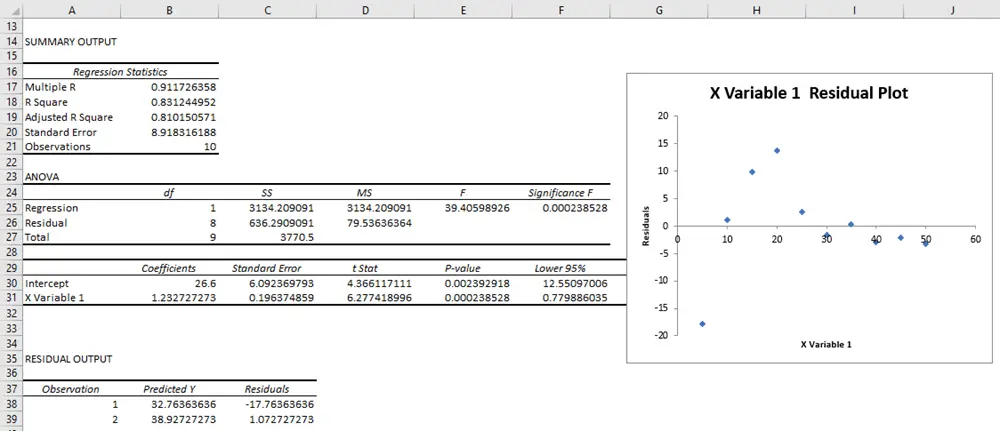
The Summary Output will take place in cell A14, and the Residual Plot will be beside the table.
Conclusion
You can apply any of the methods in this article. Both will work perfectly and the second method will give you additional details like residual statistics, ANOVA table, etc. Share your comments about this blog in the comment section. Also, keep visiting our site to learn more about Microsoft Excel. Happy Excelling!