How to Make a Supply and Demand Graph in Excel
A supply and demand graph is a visual representation of the relationship between the quantity of a product or service…
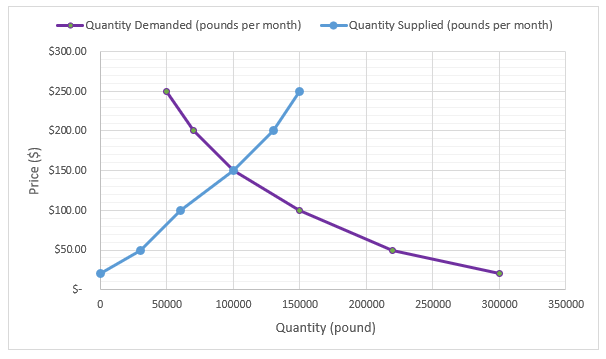
A supply and demand graph is a visual representation of the relationship between the quantity of a product or service…
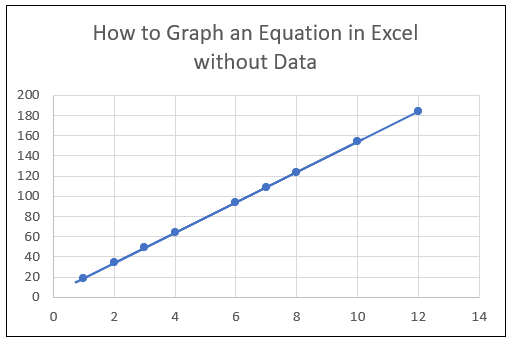
Do you know you can save a lot of time by graphing an equation in Excel without entering the dataset…

When working with large datasets or complex formulas in Excel, you may encounter errors that can hinder your progress. One…
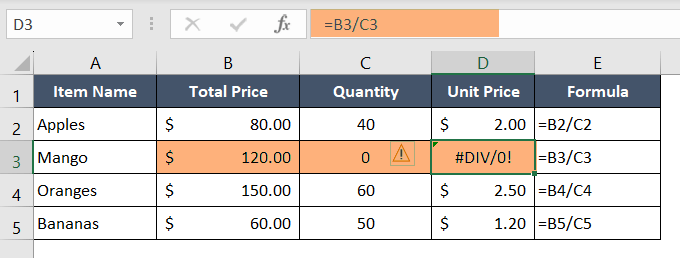
When working with formulas, you may occasionally encounter errors that can disrupt your workflow. One such error is the #DIV/0!…
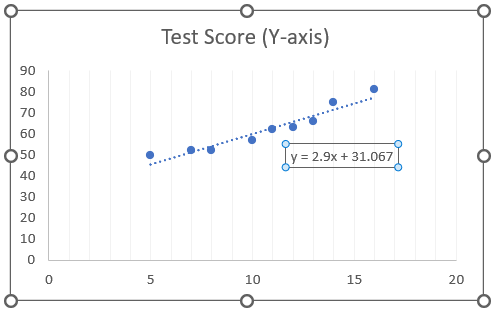
Using graphs and charts in business is an intelligent way to represent the data visually. The slope is an element…
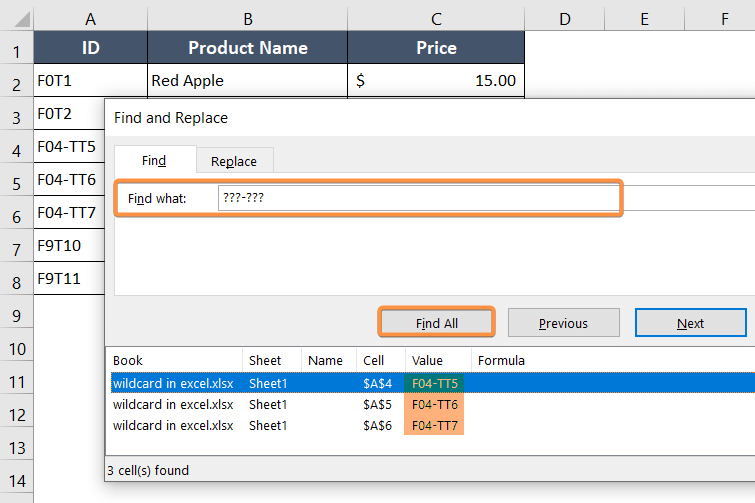
In the world of Microsoft Excel, one of the most powerful tools at your disposal is the wildcard. The wildcard…
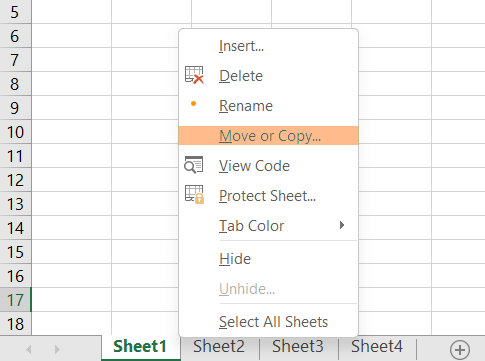
Excel, the most popular spreadsheet software from Microsoft, offers a multitude of features to help professionals manage and analyze data…
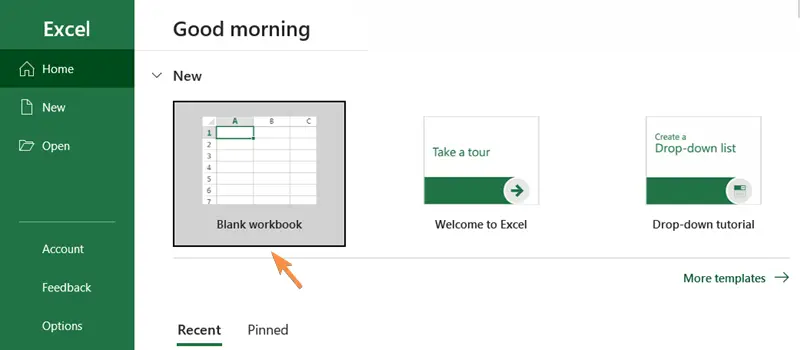
Microsoft Excel is an indispensable tool for managing and analyzing data in various industries. From simple calculations to complex data…
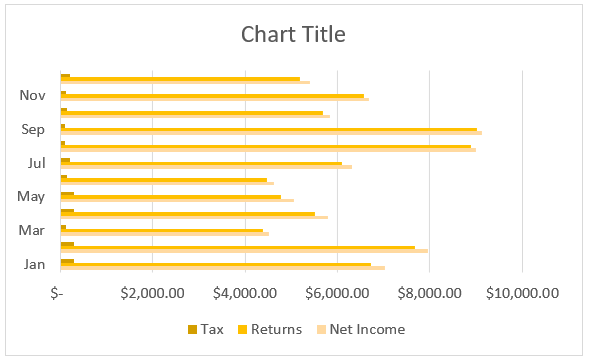
The Bar Chart and the Column Chart are technically the same thing. Using the Bar Chart is suitable when your…
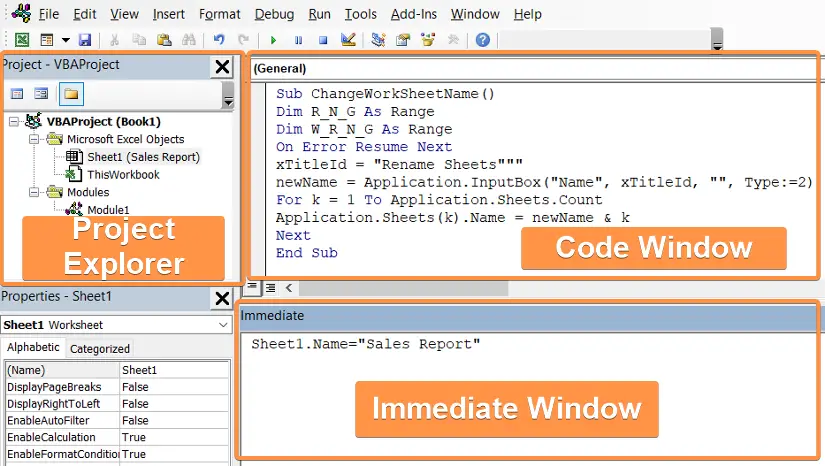
The Visual Basic Editor (VBE) is an integrated development environment (IDE) that enables users to create and automate powerful macros,…