How to Create a Correlation Graph in Excel Correctly
Correlation graphs help determine the linear relationship between two types of variables. The variables are placed on a vertical and…

Correlation graphs help determine the linear relationship between two types of variables. The variables are placed on a vertical and…
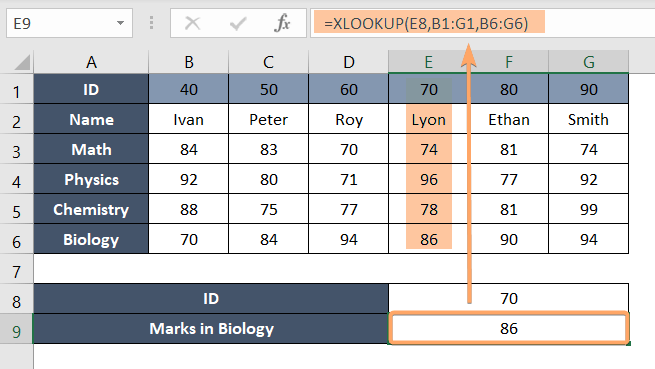
Excel’s XLOOKUP function has evolved as a modern replacement for VLOOKUP and HLOOKUP, combining their capabilities and offering enhanced features….

Microsoft Excel is a go-to application for data management and analysis, offering a plethora of functions to streamline various tasks….
![How to Select a Range in Excel [3 Ways]](https://excelgraduate.com/wp-content/uploads/2023/08/5-select-range-in-Excel.png)
In Excel, a range refers to a group of cells selected or referenced together. Understanding and working with ranges is…
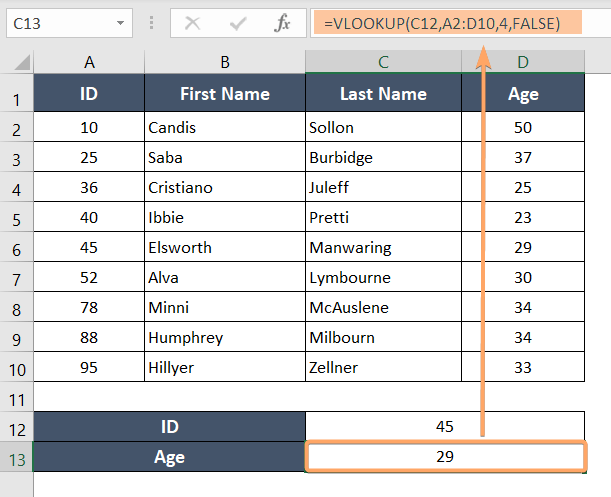
Microsoft Excel is a powerful tool for data manipulation and analysis, widely used in various industries and professions. Among its…
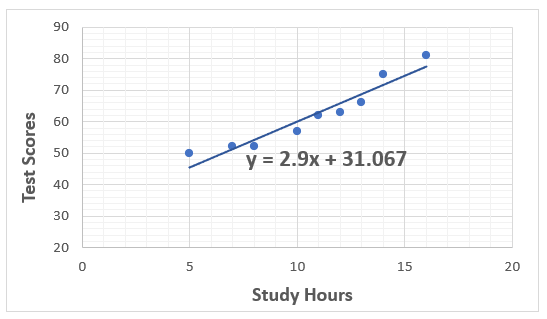
The trendline equation shows how the variables are illustrated on the graph. It gives a quick and accurate approach to…
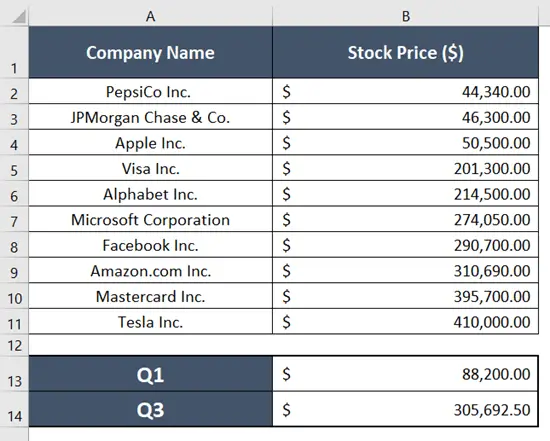
To calculate the Interquartile Range, you have to first find the first quartile (Q1) and third quartile (Q3) values. If…
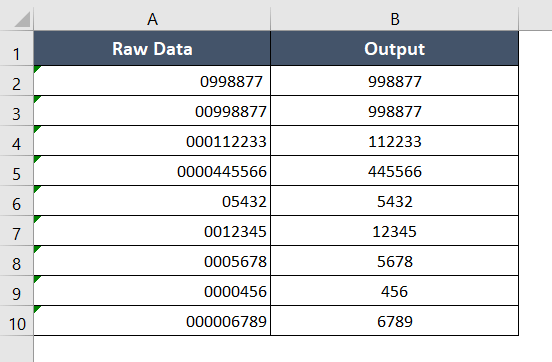
Excel is programmed to remove the leading zeroes from the worksheets by nature. But sometimes you may find the leading…

The SUBSTITUTE function is one of the text functions in Microsoft Excel. You can use it as a standalone function…

The RIGHT function is one of the most commonly used text functions in Microsoft Excel. The RIGHT function is usually…