An Overview of the Bar Chart in Excel
The Bar Chart and the Column Chart are technically the same thing. Using the Bar Chart is suitable when your…
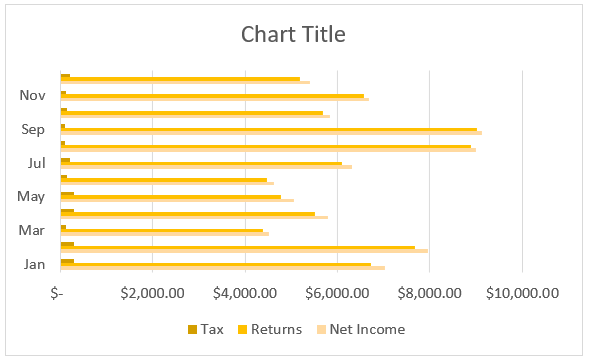
The Bar Chart and the Column Chart are technically the same thing. Using the Bar Chart is suitable when your…
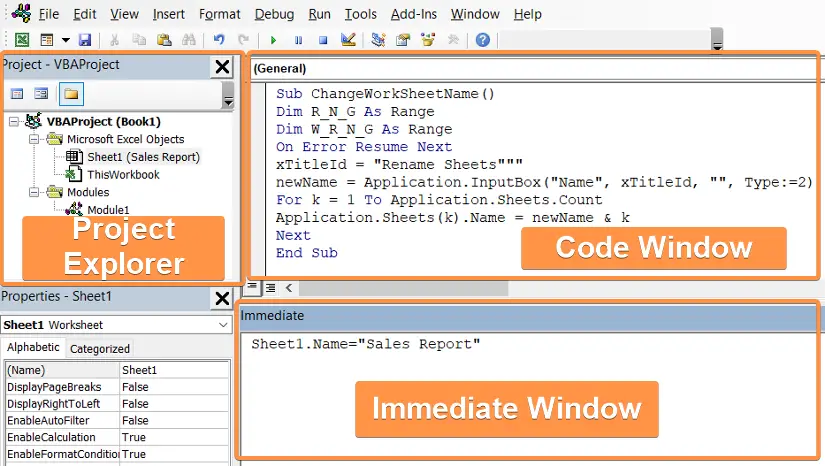
The Visual Basic Editor (VBE) is an integrated development environment (IDE) that enables users to create and automate powerful macros,…
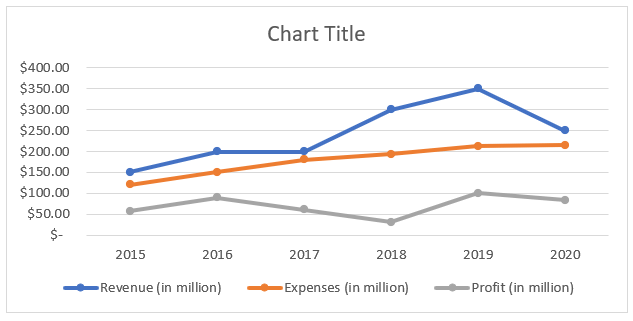
A Line Chart is used to display the trend and pattern lines over time. It is a very simple form…
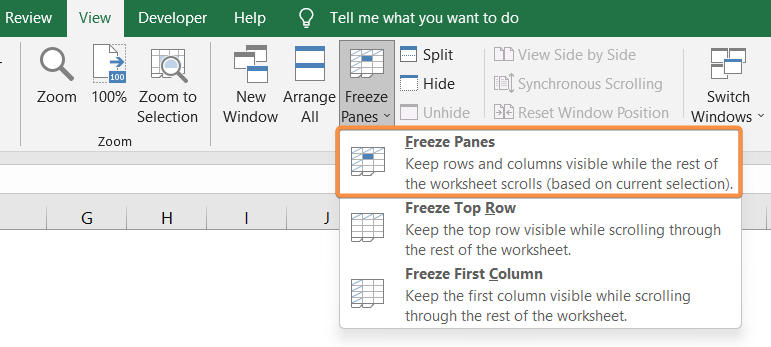
Working with large datasets in Excel can be challenging, especially when it comes to analyzing and navigating through rows and…
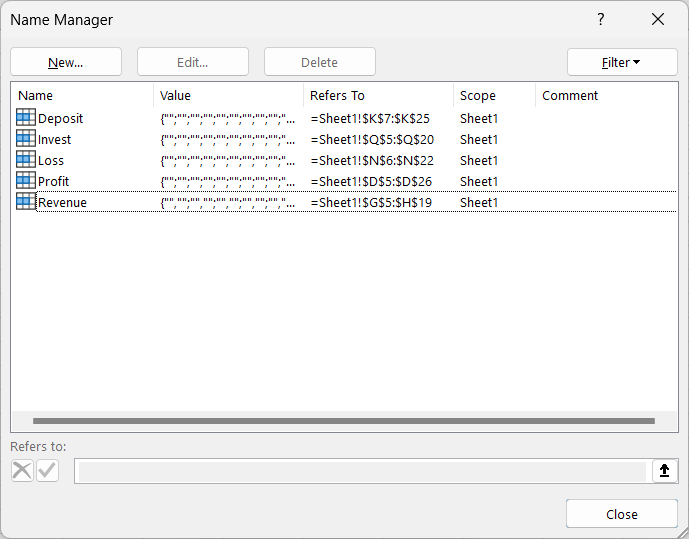
One of the most important features of Microsoft Excel is the Name Manager. It allows you to create, edit, and…
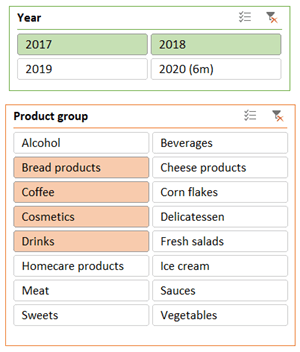
Slicer allows users to quickly isolate subsets of information from a dataset. As a result, it helps to enhance data…
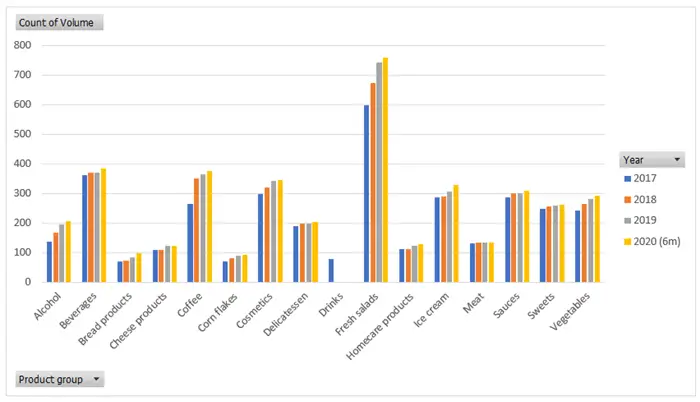
Excel offers various tools for data analysis. One of its most powerful features is the pivot chart. The best thing…

The Advanced Filter in Excel accomplishes more complex data filtering jobs than the simple AutoFilter. While AutoFilter can assist in…
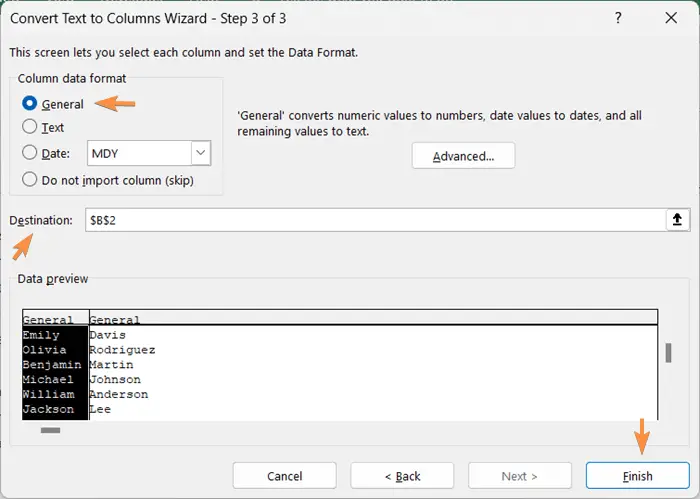
The Text to Columns feature allows splitting a single cell into multiple cells by placing a specified delimiter depending on…
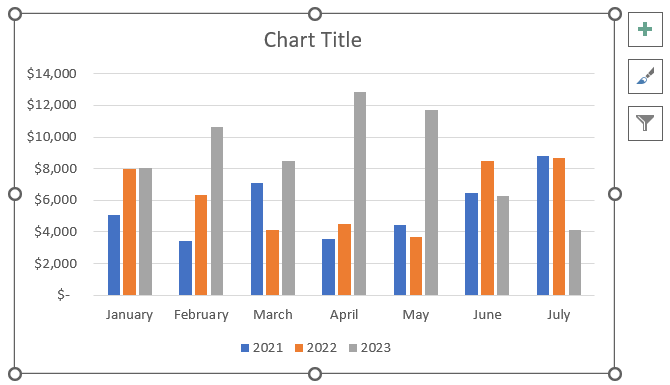
Clustered column charts make a large dataset easy to understand, even for people who are not familiar with data analysis…