How to Forecast Growth Rate in Excel [3 Ways]
If you have a record of the performance of something, for instance, your company’s sales report or your YouTube channel’s view report, you can easily predict future results using Excel. The main features of Excel for predicting the growth rate are the FORECAST function and the FORECAST SHEET command. Now, I am going to discuss 3 different ways to forecast growth rates in Excel.
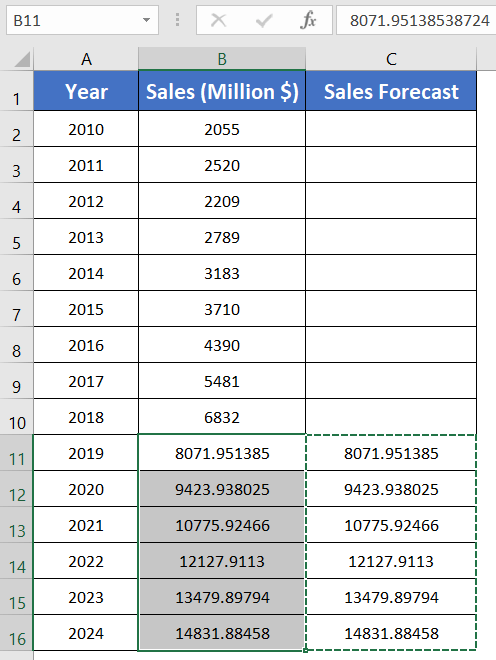
Here I have a dataset of the Sales record (Column B) of a retail shop from 2010 to 2018 (Column A). I will use this dataset to forecast (Column C) the growth rate of the company for the next 6 years, from 2019 to 2024.
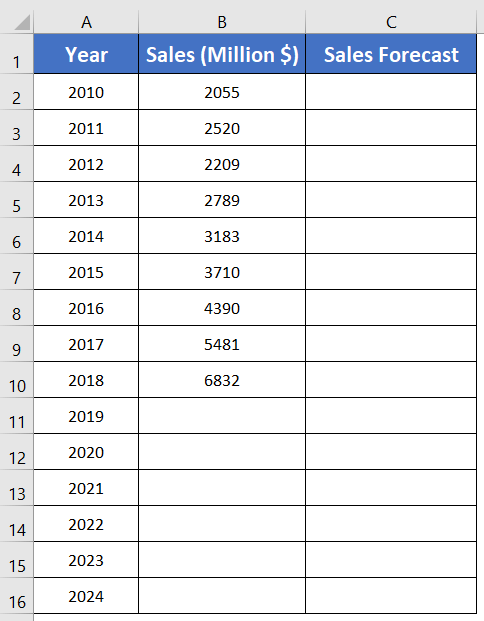
Forecast Growth Rate in Excel Using FORECAST.ETS Function
In most cases, you are not going to see the historical values in a linear trend. The values will rise sometimes, and drop sometimes. For these cases, using the Exponential Tripple Soothing (ETS) algorithm will be appropriate. So now, I am going to use FORECAST.ETS function here.
Syntax
=FORECAST.ETS (target date, values, timeline, [seasonality], [data completion], [aggregation])Here is the formula to forecast the growth rate:
=FORECAST.ETS(A11,$B$2:$B$10,$A$2:$A$10)Here,
- A11 is our target date for finding the outcome.
- $B$2:$B$10 is our chosen value range for the formula. And the $ signs refer to the Absolute Cell Reference.
- $A$2:$A$10 is the timeline of the selected value range.
- Seasonality is optional, you can skip this part. If seasonality is not mentioned, Microsoft Excel will automatically assume the seasonality is 0.
- Data Completion is also optional. Excel will allow a maximum of 30% of missing or neglected data. You can either enter 1 or skip entering the Data Completion.
- Aggregation is also optional. The Aggregation function is used to comprise functions like AVERAGE, SUM, COUNT, COUNTA, MIN, MAX, MEDIAN, etc.
Steps to forecast the growth rate with FORECAST.ETS function:
- Select a cell C11.
- Type the following formula: =FORECAST.ETS(A11,$B$2:$B$10,$A$2:$A$10)
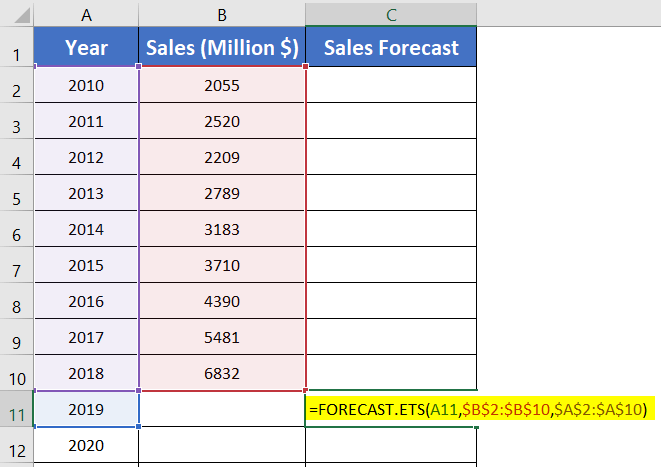
- Press ENTER to apply the formula.
- Now double-click on the Fill Handle icon to copy down the formula.
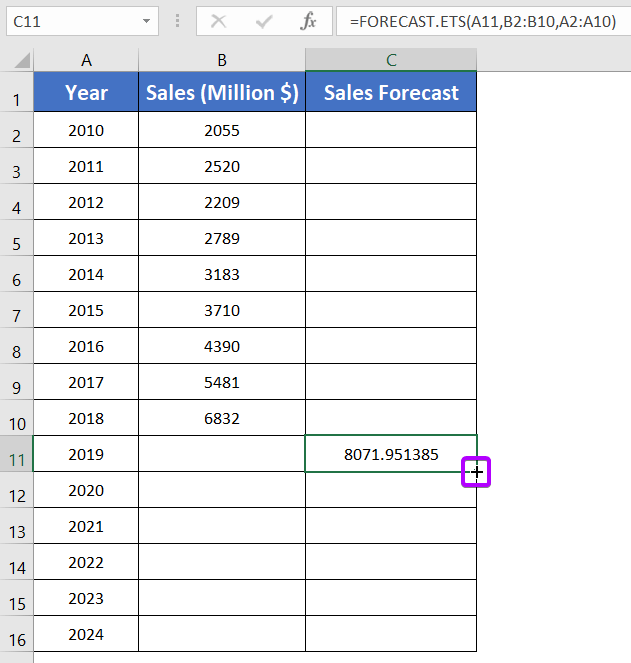
- Select the cell range from C11 to C16.
- Press CTRL+C to copy the cell range.
- Right-click on cell B11 to open the context menu.
- Under the context menu, from the Paste Options, select the second icon (Paste Values).
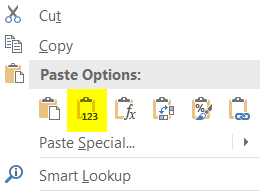
All the sales data are in Column B now.
Generate a Forecast Graph
Now, go through these steps to generate a forecast graph:
- Select Column A and Column B.
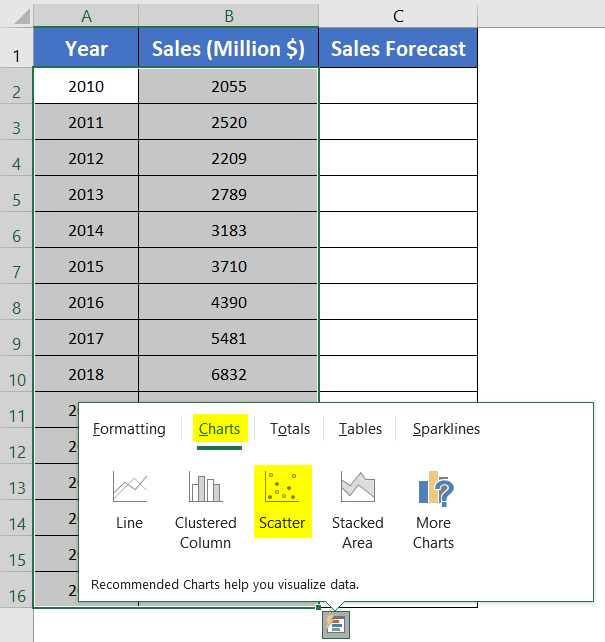
Or, press the SHIFT+ENTER+↓ arrow key. - From the Quick Analysis button, click on the Charts section and then select the Scatter option.
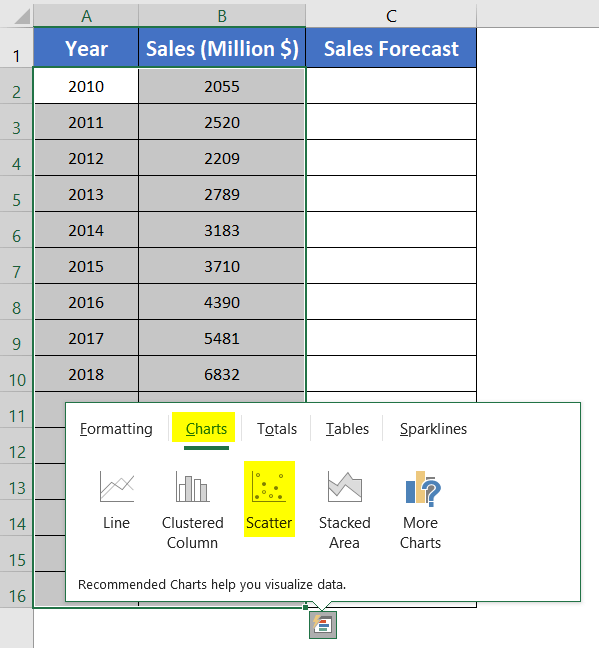
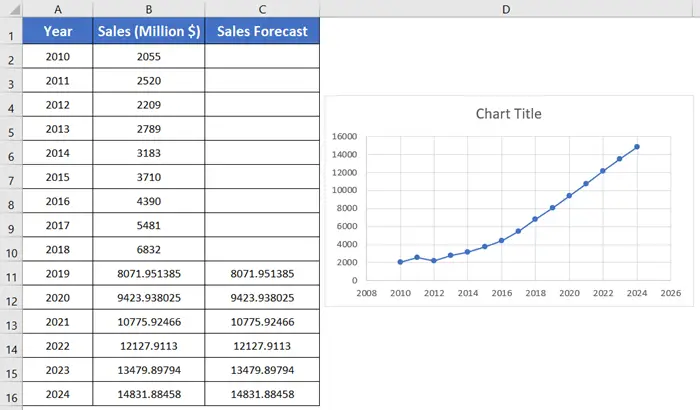
The values are represented in a scatter chart now and are easy to understand.
Forecast Growth Rate in Excel with FORECAST.LINEAR Function
Another method is to use FORECAST.LINEAR Function. The FORECAST.LINEAR Function will successfully give output for the same dataset. But the FORECAST.LINEAR Function works most suitably for the linearly progressed values.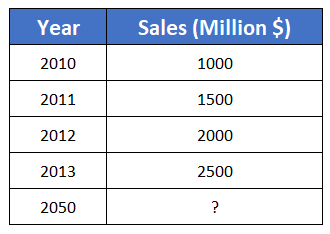
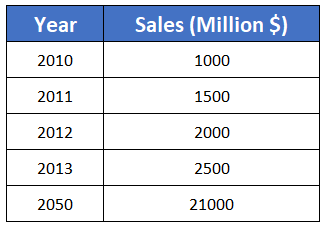
Notice the values have increased by $500M. In this sort of case, the FORECAST.LINEAR Function will deliver the right result.
Syntax
=FORECAST.LINEAR(x, known_ys, known_xs)Formula with FORECAST.LINEAR:
=FORECAST.LINEAR(A11,$B$2:$B$10,$A$2:$A$10)The values (ys) depend on the timeline (xs) in this formula:
- A11 is the target time for forecasting the growth rate.
- $B$2:$B$10 is the known ys or the given values in the data table.
- $A$2:$A$10 is the known xs. It is placed against the known ys.
Steps to forecast growth rate using FORECAST.LINEAR function:
- Select an empty cell.
- Type the following formula: =FORECAST.LINEAR(A11,$B$2:$B$10,$A$2:$A$10)
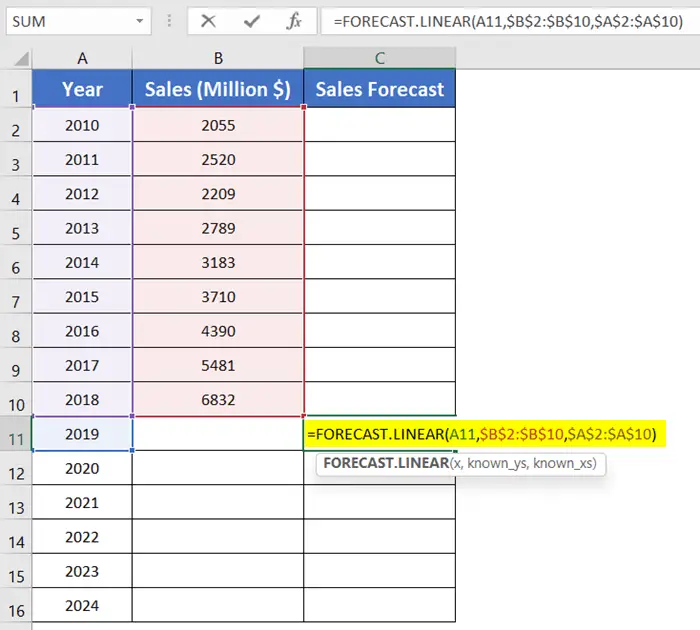
- Press ENTER.
- Copy down the formula using the Fill Handle icon.
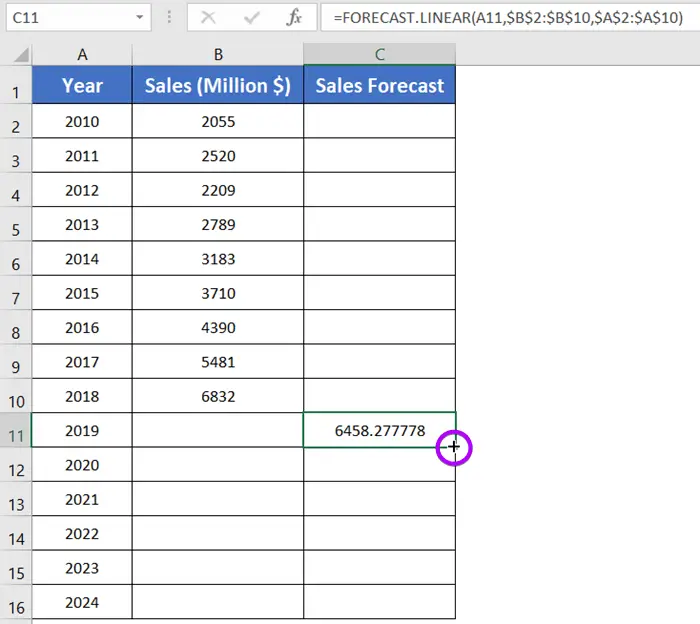
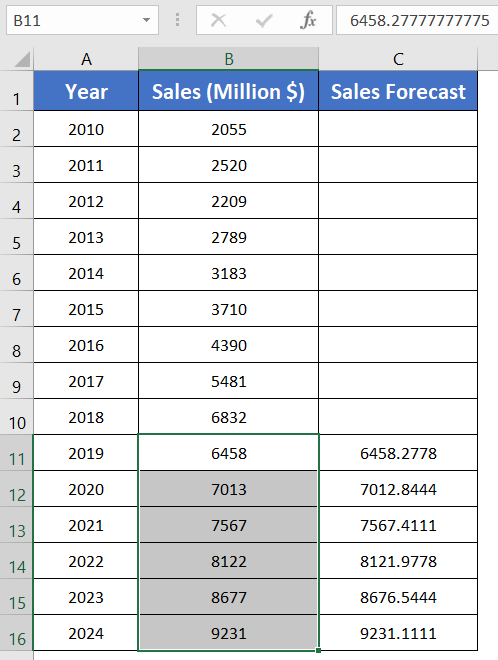
- Select the cells from C11 to C16.
- Press CTRL+C to copy the values of the cells.
- Press CTRL+V to paste the values in cell B11.
Generate a Forecast Graph
To generate a forecast graph in Excel, follow these steps:
- Select the two columns: Column A as the x-axis and Column B as the y-axis.
Or, press the SHIFT+ENTER+↓ arrow key).
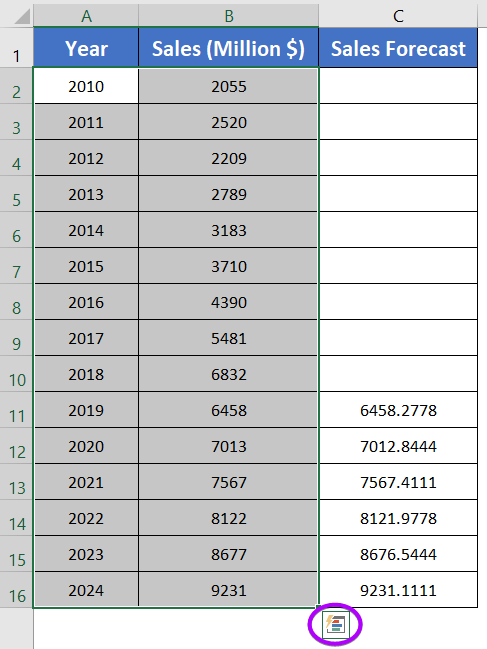
- Click on the Quick Analysis button.
- From the Charts section, select the Scatter command.
You will find the results illustrated in a line chart. But the line has a sharp fall after 2018. After 2019, the line is showing linear growth.
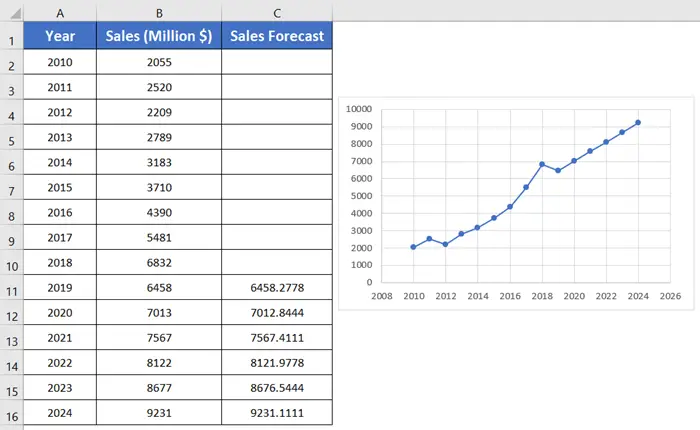
This transition of values is not practical. The linear growth occurred because of the FORECAST.The LINEAR function shows a linear increase.
Note: The FORECAST.LINEAR function performs best for the linear progression patterns.
Forecast Growth Rate in Excel Using FORECAST SHEET
The Forecast Sheet is a great tool that presents forecasting with the Upper Confidence Bound and the Lower Confidence Bound. Sadly, this feature is new in Microsoft Excel and available in Excel 2016 and later versions.
Here are the steps below to do that:
- Create a column for the timeline (Column A) or the dates.
- Create a column for the values (Column B).
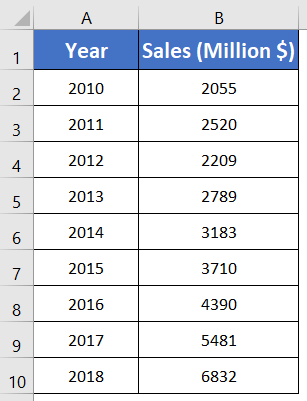
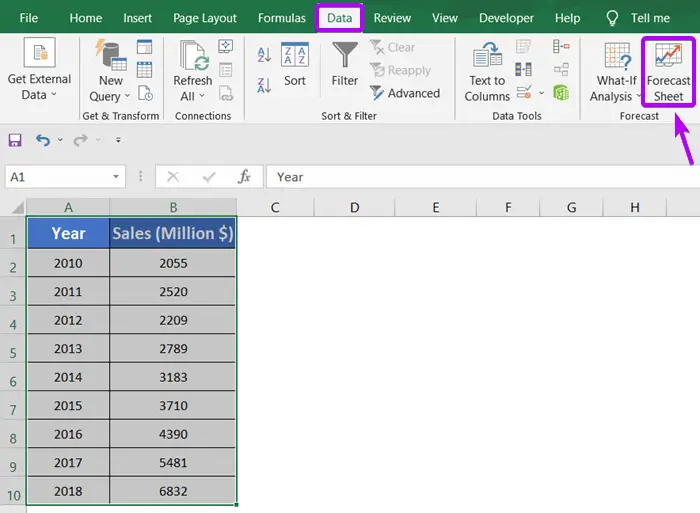
- Now select Column A and Column B.
- Select the Data tab.
- From the Forecast group, click on the Forecast Sheet option.
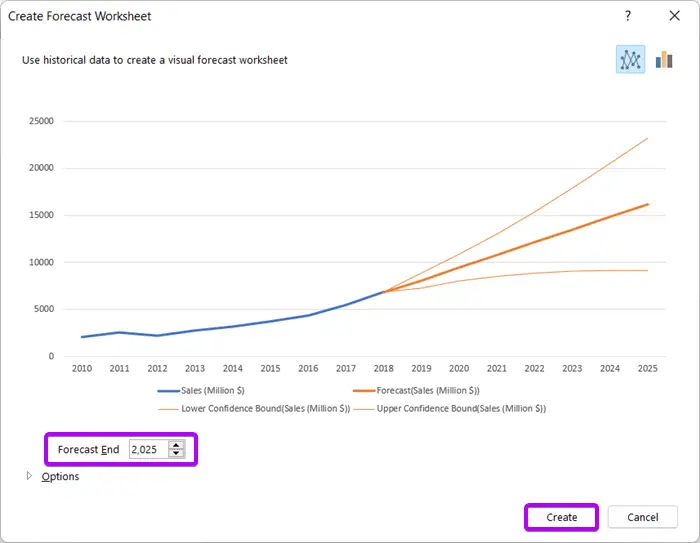
 The Create Forecast Worksheet window will come along on the screen.
 - From the Forecast End box, choose the ending time of the forecast.
- Hit on the Create button.
You will see the forecasted sheet is delivered in another sheet.
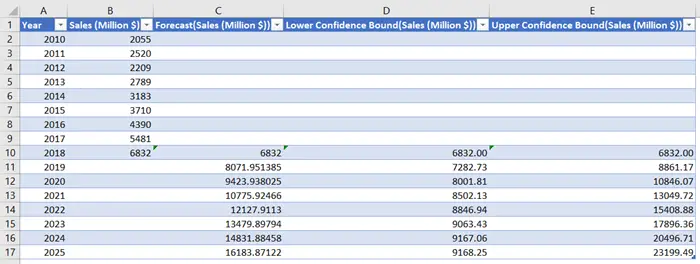
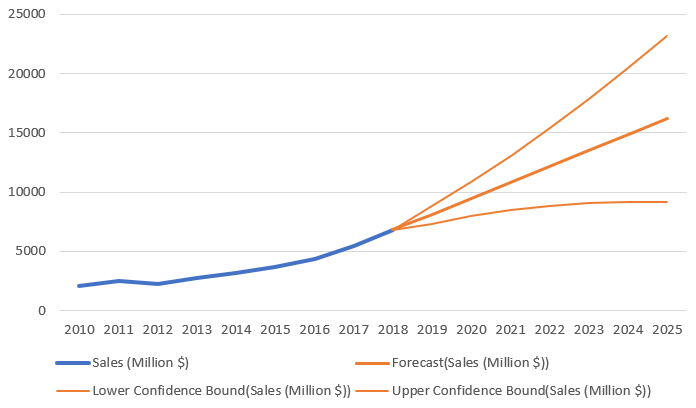
Also, the result is presented in a tabular form with the Lower Confidence Bound and Upper Confidence Bound in the table. Besides the table, the forecast is also shown in a chart.
Conclusion
The three methods I have discussed regarding forecasting growth rate can give you results for any kind of dataset. But each one has a slight difference from the other and has specific features. I hope the article may help you to solve your problem about forecasting the growth rate in Excel. Thank you.
Frequently Asked Questions
What is the formula for forecasting?
The formula for forecasting in Excel involves using the Exponential Smoothing (ETS) algorithm, often implemented with the FORECAST.ETS functions. This algorithm considers both trend and seasonality in time series data, providing a reliable method for predicting future values based on historical patterns.
What is the average growth rate in Excel?
In Excel, you can calculate the average growth rate using the formula: =RATE(N, PMT, PV, FV, Type)
Here, N is the number of periods, PMT is the payment made each period, PV is the present value, FV is the future value, and Type specifies whether the payment is made at the beginning or end of the period. This formula helps determine the average growth rate over cash flows or investments.
What forecasting method is used in Excel?
In Excel, the forecasting method commonly used is the Exponential Smoothing (ETS) algorithm. ETS is a time series forecasting technique that considers both trend and seasonality in data, providing accurate predictions for future values. The FORECAST.ETS functions in Excel facilitate the application of this method for forecasting in various scenarios.
Related Articles
- How to Calculate Annual Growth Rate in Excel (5 Different Cases)
- Calculate Dividend Growth Rate in Excel [2+ Formulas]
- 2 Ways to Calculate Bacterial Growth Rate in Excel
- 2 Ways to Calculate Revenue Growth Rate in Excel
- 3 Scenarios of Exponential Growth Formula in Excel
- 2+ Ways to Calculate Monthly Growth Rate in Excel