2 Ways to Calculate Bacterial Growth Rate in Excel
Calculating bacteria growth rates manually can be very tiring and time-consuming for anyone because the numbers are very large. But the good news is you don’t need to calculate the bacterial growth rate manually anymore. Because you can use Microsoft Excel to calculate the bacterial growth rate quite easily. And, also it can generate curves portraying the results. Now, I am going to show you 2 ways to calculate the bacterial growth rate in Excel.
What is Bacterial Growth Rate?
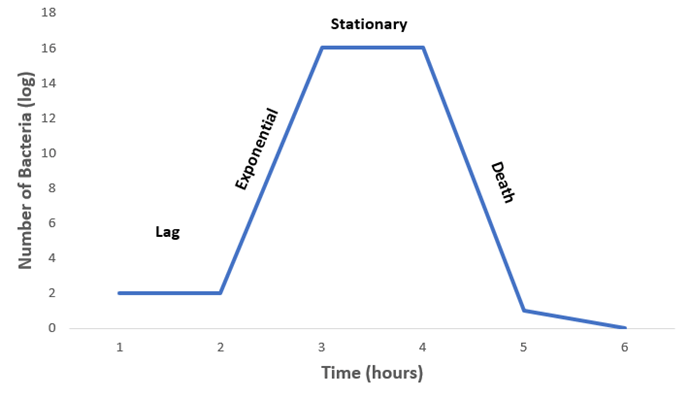
Under favorable conditions, the bacterial population increases in a geometric sequence. The bacterial population doubles its number in a periodic pattern. Like if the culture has 2 bacteria in 1 hour, it will be 4 in 2 hours, 8 in 3 hours, 16 in 4 hours, and the number goes on.
This phenomenon is called Exponential growth. Exponential growth is only possible in favorable conditions, in the laboratory.
Bacterial Growth Rate Formula
The increase in bacterial cultures with duration is constant for a bacterial medium. It is symbolized using μ.
The equation for the bacterial growth rate formula is,
Rate of increase of bacterias = μ*(Change of time)
Or, ln Nt – ln N0 = μ (t – t0)
Or, μ = (ln Nt – ln N0) / (t – t0)
∴ μ = (log Nt – log N0)*2.303/(t – t0)
Here,
- μ = Bacterial growth rate
- Nt = Total bacteria number at the time (hour), t
- N0 = Total bacteria number at the time, t0
- t = Time of calculating the growth rate
- t0 = Beginning time of bacteria counting
You can calculate the time in hours or minutes. It depends on your required interval.
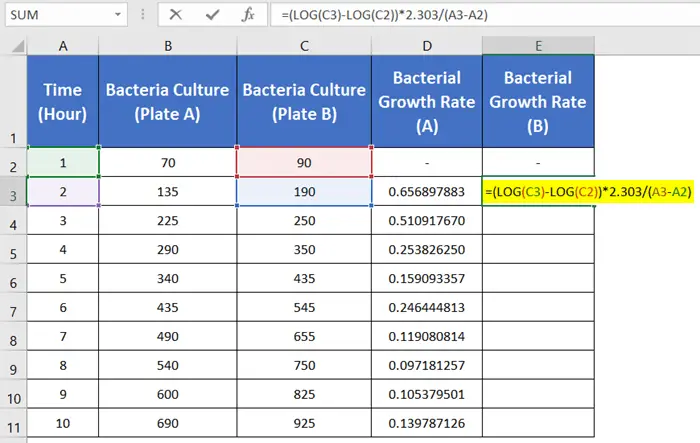
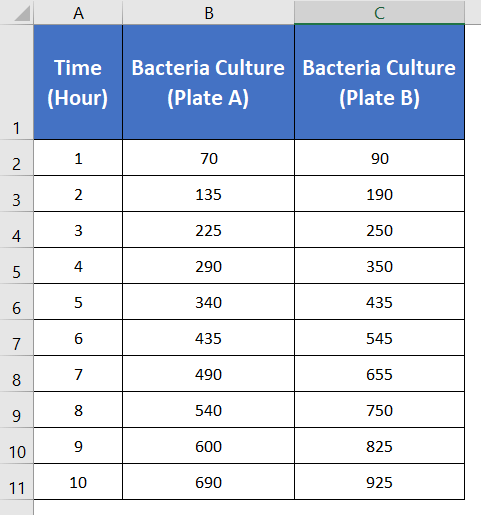
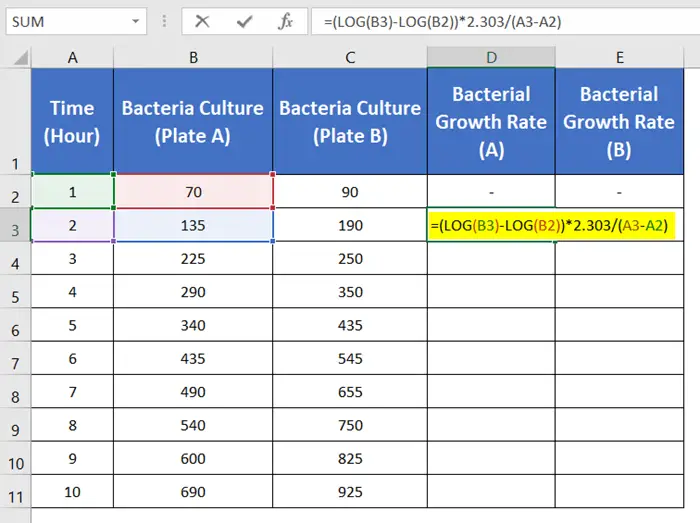
To give you an example, I am using a dataset of two bacteria-cultured plates in a given range of time. Plate A (column B) and Plate B (column C) cultured different numbers of bacteria at the same time range (column A).
Calculate Bacterial Growth Rate in Excel Using LOG Function
First, I am going to show you the most used method of finding the microbial growth rate. For this purpose, I’m using the LOG function.
The formula with LOG function in Excel:
=(LOG(B3)-LOG(B2))*2.303/(A3-A2)Here,
- LOG(B3): Final bacteria number in Plate A
- LOG(B2): Initial bacteria number in Plate A
- A3: Final time (hour)
- A2: Initial time (hour)
Follow these steps to calculate bacterial growth rate in Excel with the LOG function:
- Select the cell D3.
- Write down this formula: =(LOG(B3)-LOG(B2))*2.303/(A3-A2)

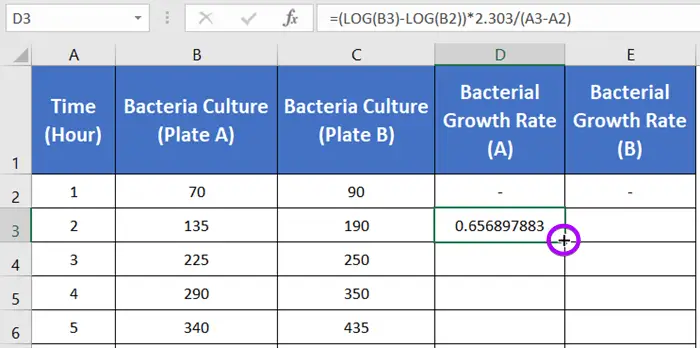
- Press ENTER to apply the formula.
- Double-click on the Fill Handle ‘+’ icon to copy down the formula.
 The Fill Handle copied the formula through the entire column D.
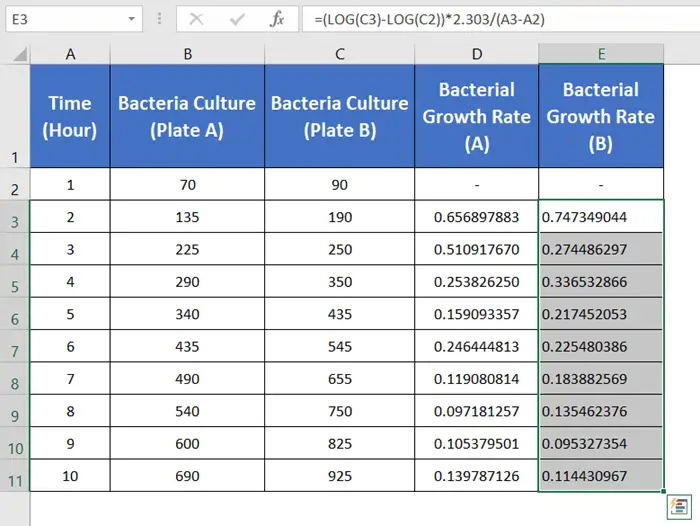
Here, I didn’t apply the formula from the top cell (D2) because there is no change in the bacterial number at the culture’s beginning time. - Again type the formula in cell E3 for the bacteria of Plate B:=(LOG(C3)-LOG(C2))*2.303/(A3-A2)

- Press ENTER.
- Double-click on the Fill Handle to fill down the formula.
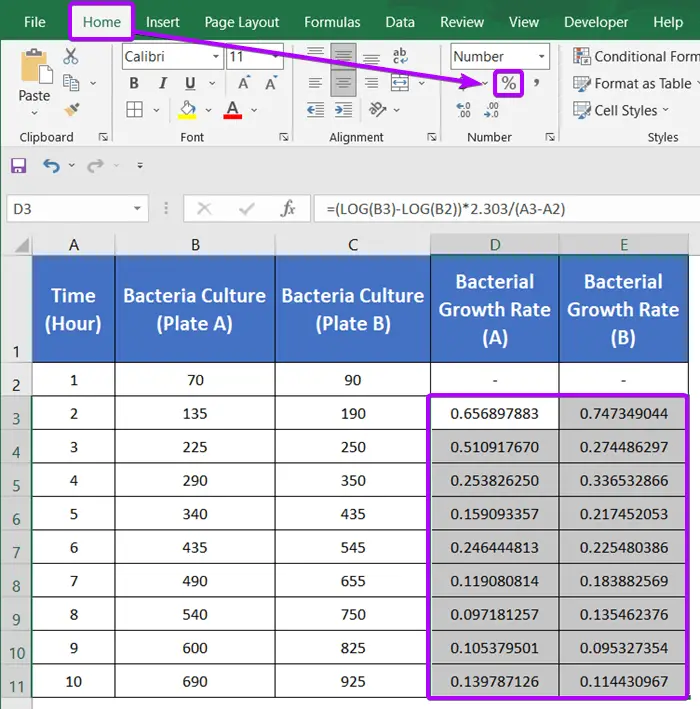
 You will see the results in decimal format. But usually, we don’t express the rate in decimal formats. So I like to change the form to a percentage (%).
 - Now, select the range of decimal numbers, from D3 to E11.
- Click on the Home tab.
- From the Number group, click on the % option.

Now you will find the results are nicely presented in percentage form.
Cons: You need to remember the main equation of bacterial growth rate.
Calculate Bacterial Growth Rate in Excel Using a Chart
We can input the bacteria growth number with the corresponding time to generate a curve. Then we will use an Excel command to generate an equation that represents the curve. From the equation, we can easily find out the bacterial growth rate.
The equation that Excel will generate out of the curve has the following format:
Exponential Formula of Bacteria Growth Rate, Y = b*m^x
Here,
- Y depends on the value of x. So it is the total number of bacteria in the x given time.
- m is used as the base for x. Here, m is the bacterial growth rate.
- b is a fixed or constant value.
Step 1: Insert a Chart
Initially, insert a chart before calculating the bacterial growth rate in Excel. To do that, follow the steps below:
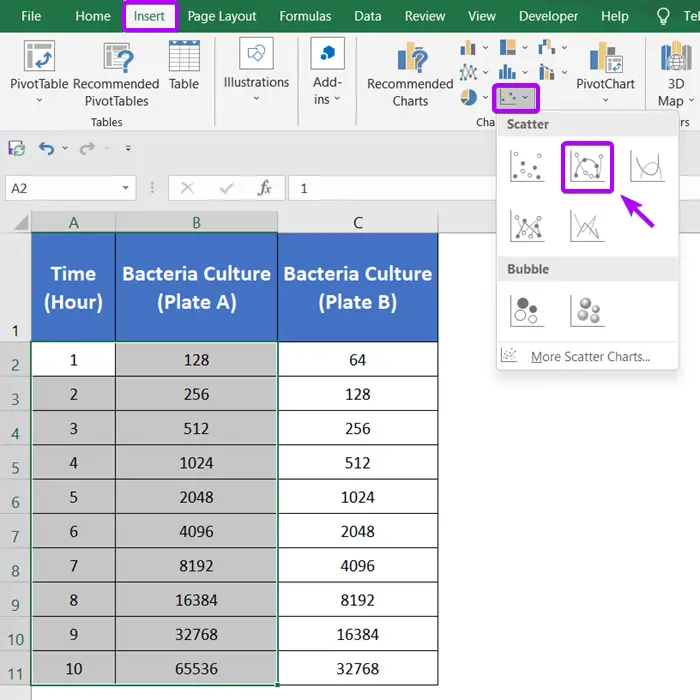
- First, select the two columns, Column A [Time (Hour)] and Column B [Bacteria Culture (Plate A)].
- Click on the Insert tab.
- From the Charts group, click on the Scatter drop-down menu.
It depends on your preference for which scattering style you like. I picked the second option from the list.

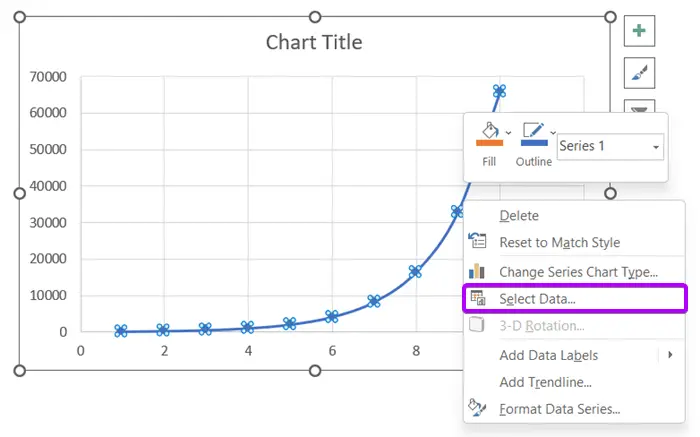
- Now click on the blue curve and select the Select Data command.
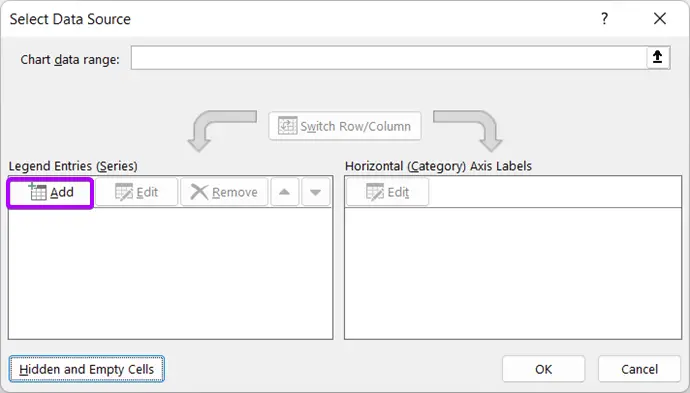
 The Select Data Source window will come along on the screen.
 - Hit the Add button.
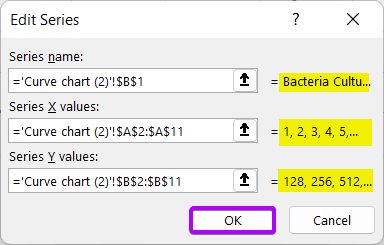
 The Edit Series window will pop up.
Now Input the ranges in the window. - For the Series Name, click on cell B1 to input the name Bacteria Culture (Plate A).
- For Series X Values, select the cell range A2:A11, and in the Series Y Values, input the range from cell B2 to B11.
To make you understand better, you will see the outputs are delivered on the right side of the input boxes. I have yellow-marked the examples. - Then hit the OK button.
 This will lead you back to the previous Select Data Source window.
 - Repeat the process from step_5 to step_9 for Bacteria Culture (Plate B) and press the OK button.
Note: For Bacteria Culture (Plate B), don’t change the X values. Change only the Y values and insert the cell range C2:C11.
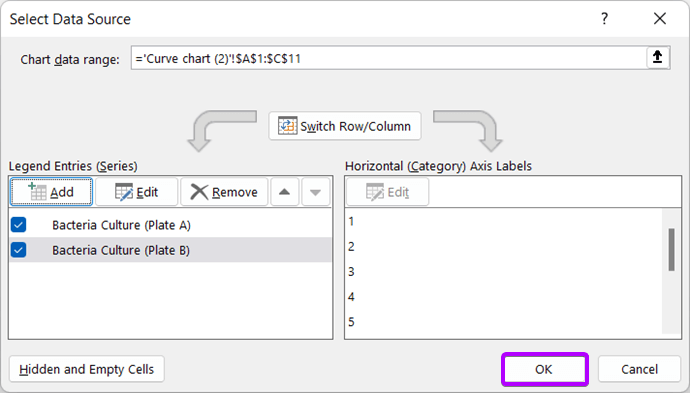
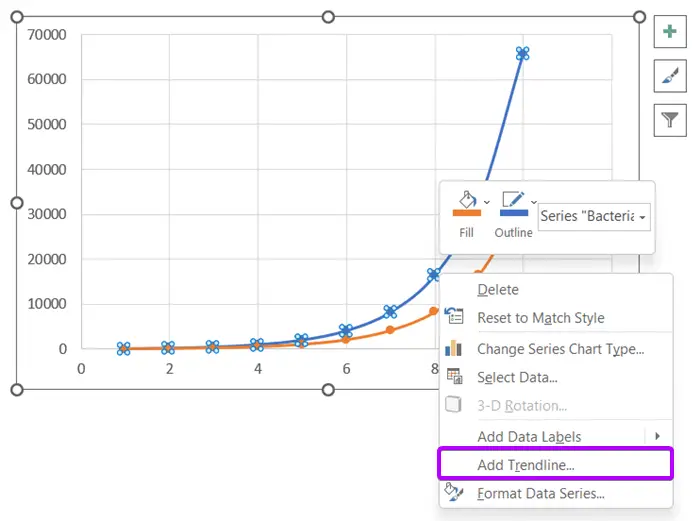
Two curves will appear on the diagram. One is blue and the other one is orange.
Step 2: Display Equation on Chart
To display the equation on the chart, follow these steps:
- Now right-click on the blue curve.
- From the context menu, click on the Add Trendline option.
 On the right side of your screen, the Format Trendline common box will come along.
 - Click on the Exponential radio button from the Trendline Options.
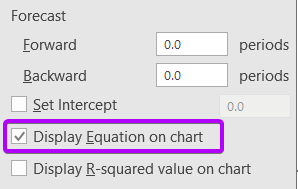
- After that, scroll down and give a tick mark on the Display Equation on the Chart checkbox.

- Now select the orange curve, and repeat from steps 1-4.
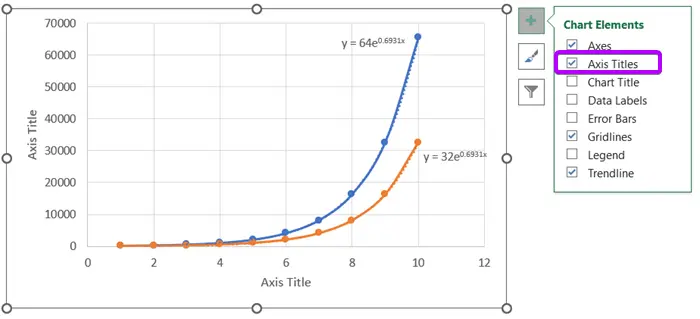
The following steps returned the equations on the chart beside each curve.
Normally, I prefer to remove the Chart title and add the Axis titles for preparing the reports.
A Chart title is generally appropriate for making a PowerPoint presentation or something like that. - Click on the big ‘+’ sign and checkmark the Axis Titles.

- Change the Axis Titles with appropriate names.
Here is the final outcome. Have a look.
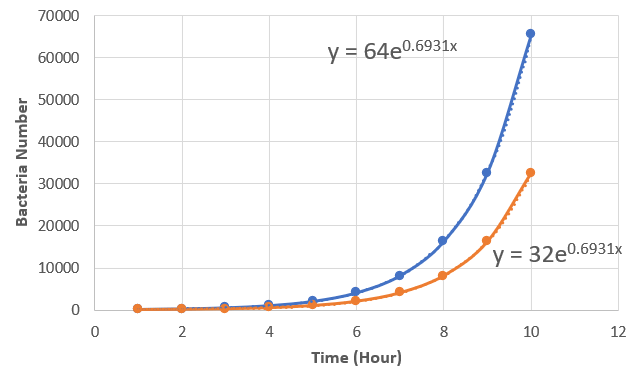
The basic equation we used for this method was Y = b*m^x. Now, you look at the results. One is y=64e0.6931x and the other one is y=32e0.6931x.
Compare your findings with the basic equation and take the numbers before the X variable as the bacterial growth rate. In my case, the results are 69% for both bacterial cultures.
Pros: You will get the curve chart of the bacteria growth and the results of the growth rate at the same time.
Cons: The method is a bit lengthy.
Conclusion
I hope these two methods will help you count the bacterial growth rate in Excel. Feel free to let us know if you have any questions regarding bacterial growth rate calculation.
Frequently Asked Questions
What is the growth rate formula?
The growth rate formula is expressed as: Growth Rate = ((Ending Value/Beginning Value)^(1/Number of Periods))−1
This formula calculates the rate of growth over a specified period, such as years or months, and is commonly used in finance and business analysis.
What is an example of a growth rate?
An example of a growth rate is when an investment increases from $1,000 to $1,200 over two years.
Using the growth rate formula, the calculation would be Growth Rate = ($1,200$1,000)12−1 resulting in a growth rate of 0.095, or 9.5%.
Related Articles
- How to Calculate Annual Growth Rate in Excel (5 Different Cases)
- Calculate Dividend Growth Rate in Excel [2+ Formulas]
- 3 Ways to Forecast Growth Rate in Excel
- 2 Ways to Calculate Revenue Growth Rate in Excel
- 3 Scenarios of Exponential Growth Formula in Excel
- 2+ Ways to Calculate Monthly Growth Rate in Excel
 The Fill Handle