How to Find Interquartile Range (IQR) in Excel [Free Calculator]
What is Interquartile Range (IQR)?
In simpler terms, the interquartile range (IQR) is a measure of how spread out or dispersed the middle 50% of a data set is. It tells you how much the data varies in the middle half of the distribution, and is less influenced by extreme values or outliers than other measures of spread.
To calculate the IQR, you find the difference between the third quartile (Q3) and the first quartile (Q1), which gives you a range that contains the middle 50% of the data. The IQR is often used to identify outliers or extreme values in the data and is also used in box plots to show the distribution of the data.
Interquartile Range (IQR) Formula
The formula to calculate IQR is: IQR = Q3 – Q1
Here,
- Q1 = 1st quartile or 25th percentile.
- Q3 = 3rd quartile or 75th percentile.
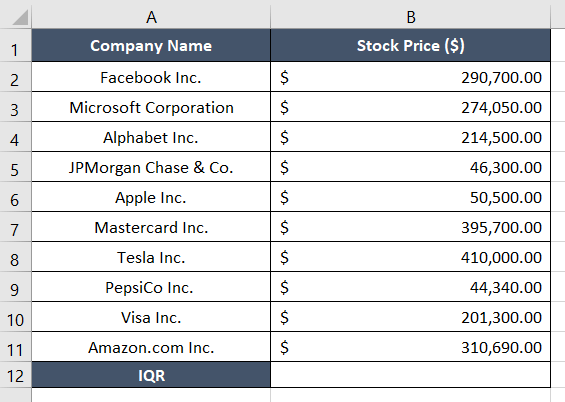
In the following dataset, there are two columns, Company Name, and Stock Price. The stock prices of each brand are different and are arranged in an arbitrary order.

The Process to Calculate Interquartile Range (IQR) in Excel
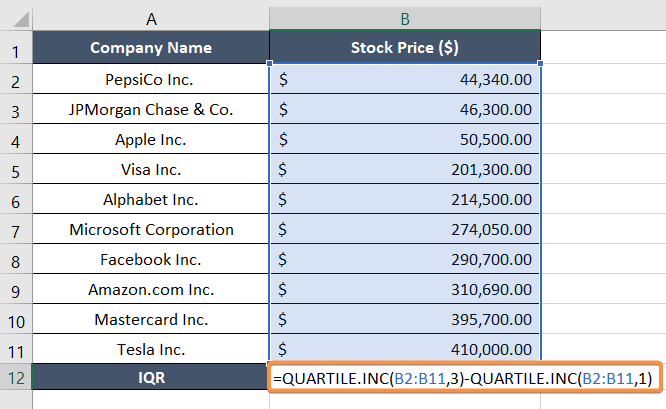
To find the IQR in Excel, I will first organize the values in ascending order and then apply the QUARTILE function. The formula here is:
=QUARTILE.INC(B2:B11,3)-QUARTILE.INC(B2:B11,1)Here,
- B2:B11 is the selected cell range.
- 3 is the 3rd quartile, which is the 75 percentile.
- 1 is the 1st quartile, which is the 25 percentile.
To apply the QUARTILE function and find the IQR in Excel, go through the steps below:
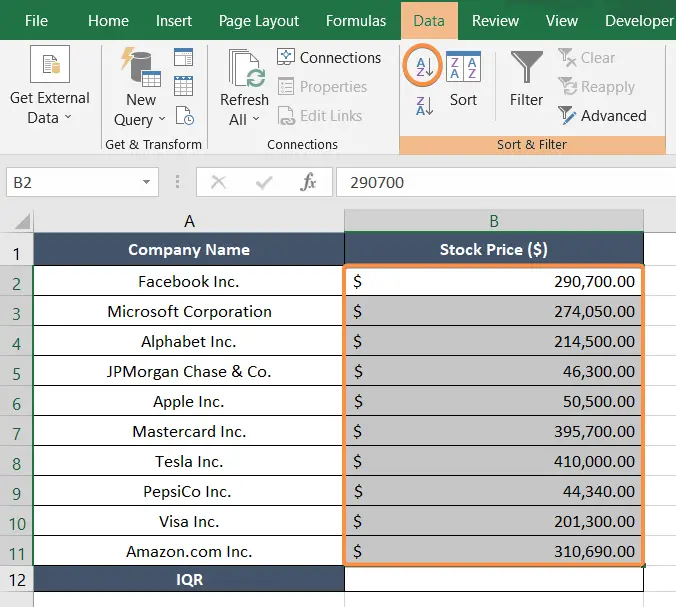
- First, select the cell range B2:B11.
- Now, select the Data tab from the ribbon.
- Then, select the Sort A to Z icon from the Sort & Filter group.
 Now the cell values are in ascending order.
 - In cell B12, type the following formula: =QUARTILE.INC(B2:B11,3)-QUARTILE.INC(B2:B11,1)

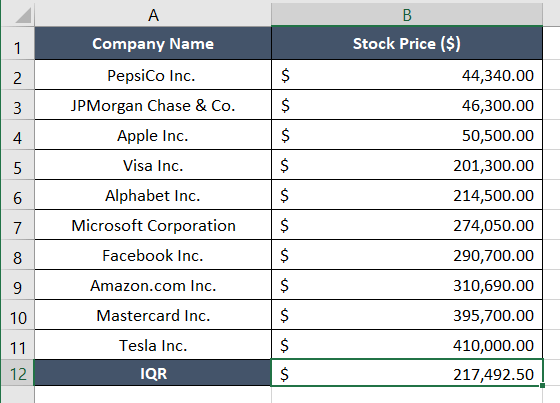
As I applied the formula, it instantly delivered the interquartile range (IQR) of the stock prices. In this case, the interquartile range is $217,492.50. This means the difference between to 3rd quartile (Q3) and the first quartile (Q1) is $217,492.50.

Quartile Calculator
Here,
- Q1, or the first quartile, is the value at which 25% of the data falls below it. It is also known as the lower quartile. This means that Q1 divides the data set into two parts: the lower 25% and the upper 75%.
- Q2, or the second quartile, is the value at which 50% of the data falls below it. It is also known as the median. This means that Q2 divides the data set into two equal parts: the lower 50% and the upper 50%.
- Q3, or the third quartile, is the value at which 75% of the data falls below it. It is also known as the upper quartile. This means that Q3 divides the data set into two parts: the lower 75% and the upper 25%.
Quartile Example
Let’s say I have a dataset of 10 numbers: 5, 1, 4, 2, 6, 7, 9, 3, 100, 8
First, to find the IQR, I arranged the numbers in ascending order: 1, 2, 3, 4, 5, 6, 7, 8, 9, 100. Then, I located the Q1, Q2, and Q3 of the given numbers: 1, 2, 3, 4, 5, 6, 7, 8, 9, 100.
Q1 = (2+3)/2 = 2.5
Q2 = (5+6)/2 = 5.5
Q3 = (8 + 9)/2 = 8.5
Then, I applied the IQR formula which is the difference between Q3 and Q1,
IQR = Q3 – Q1 = 8.5 – 2.5 = 6
So, the IQR is 6.
Interquartile Range (IQR) Outlier
An outlier is defined as a data point that is either smaller than the lower bound or larger than the upper bound. Any value outside of this limit will be considered an outlier.
Therefore, it is important to identify and handle outliers appropriately. Outliers can distort the results of data analysis. For example, if the data follows a normal distribution, outliers can affect the mean and standard deviation.
A. Upper Outlier
It is also known as a higher outlier. Any value beyond the point of the upper bound is known as the upper outlier.
Upper Outlier Formula
= Q3 + 1.5*IQRB. Lower Outlier
Any value lower than the value of the upper bound is known as the upper outlier.
Lower Outlier Formula
= Q1 - 1.5*IQROutlier Example
I am using the same dataset used in the Quartile Example section,
1, 2, 3, 4, 5, 6, 7, 8, 9, 100
The lower and upper bounds are,
- Lower bound = Q1 – 1.5 * IQR = 2.5 – 1.5 * 6 = -6.5
- Upper bound = Q3 + 1.5 * IQR = 8.5 + 1.5 * 6 = 17.5
Any value outside this range can be considered an outlier.
You can see that the value of 100 is the only outlier in this dataset. This value is much larger than the rest of the values here. It can therefore significantly affect measurements of central tendency and variability.
Why is IQR 1.5 Times for outliers?
The standard rule for identifying outliers using the IQR is very simple. If a value is below Q1 – 1.5*IQR or above Q3 + 1.5*IQR, it is considered an outlier.
This rule is based on the assumption that the distribution of the data is approximately a normal distribution or bell-shaped distribution. In this type of distribution, the majority of the data points fall within three standard deviations of the mean. In a normal distribution, the range from the 1st quartile to the 3rd quartile covers approximately 50% of the data.
Percentile and Quartile
Both percentiles and quartiles are used to analyze and describe the distribution of a dataset. But they serve different purposes. Here are some differences between percentiles and quartiles.
| Percentile | Quartile |
|---|---|
| A metric indicating the value below which a given percentage of observations in a group of observations falls. | A type of percentile that divides a dataset into four equal parts. |
| Ranks the data in ascending order then determines the number corresponding to the required percentage. | Ranks the observations in ascending order then divides them into four equal parts. |
| Determines any value below which a given percentage of observations falls. | Divides the dataset into four equal parts, each containing 25% of the observations. |
| Used to compare an individual’s performance. | Used to describe the spread of a distribution. |
| Can be calculated for any position in the dataset. | Only calculates positions at the 25th, 50th, and 75th percentiles. |
| Provide a subtle understanding of the dataset. | Provides a general sense of the distribution of the dataset. |
| If the 25th percentile of a dataset is 10, it means that 25% of the observations in the dataset are less than or equal to 10. | Q1 is the value below which 25% of the observations fall, Q2 is the median, and Q3 is the value below which 75% of the observations fall. |
QUARTILE.INC Vs. QUARTILE.EXC Functions in Excel
QUARTILE.INC Function
The QUARTILE.INC function considers the boundaries of the quartiles to be inclusive. This means that it includes the lowest and highest data points in the calculation of the quartiles. It indicates the inclusiveness of the extreme value of the quartile. It returns a requested quartile of a supplied range of values based on a percentile range of 0 to 1 inclusive.
Syntax
= QUARTILE.INC(array, quart)- Array: The targeted data range.
- Quart: integer between 0 and 4, indicating the four quartiles.
QUARTILE.INC Function Quart Paratemer
- 0: Minimum Value
- 1: 25th percentile (1st quartile)
- 2: Median (2nd quartile)
- 3: 75th Percentile (3rd quartile)
- 4: Maximum Value (4th quartile)
QUARTILE.EXC Function
QUARTILE.EXC function considers the boundaries of the quartiles to be exclusive. This means that it does not include the lowest and highest data points in the calculation of the quartiles. The QUARTILE.EXC function returns the quartile for a given set of data based on percentile values from 0 to 1 exclusive. It can return 3 quartiles, unlike the QUARTILE.INC function, which can return 4 quartiles.
Syntax
= QUARTILE.EXC(array, quart)- Array: The range of values.
- Quart: Integer between 1 to 3.
QUARTILE.EXC Function Quart Paratemer
- 1: 25th percentile (1st quartile)
- 2: Median (2nd quartile)
- 3: 75th Percentile (3rd quartile)
So you should use QUARTILE.INC function to calculate quartiles that take the lowest and highest data points into account. And if you want to exclude them, you should use QUARTILE.EXC function.
Conclusion
I hope you got an overall idea about IQR (interquartile range) and how to find the IQR in Excel. If you’d like to know more about using Excel, visit our blog page anytime! Also, if you find something confusing about this topic, feel free to leave a comment in the comment section. Thank you!
Frequently Asked Questions
How to do Q1 and Q3 on Excel?
To find the values of Q1 and Q3, use the QUARTILE function. Suppose my array is A1:A50. Now to calculate Q1, use the formula = QUARTILE (A1:A50,1) in an empty cell. Next, to calculate Q3, type the formula = QUARTILE (A1:A50,3) in another empty cell.
How do you find the IQR?
Subtract the 3rd quartile from the 1st quartile to calculate the IQR. The basic formula to find the IQR in Excel is = QUARTILE(array,3) – QUARTILE(array,1).
Should I use QUARTILE INC or QUARTILE EXC in Excel?
If your data set contains the entire population and you want to include the minimum and maximum values in your quartile calculation, you should use QUARTILE.INC function. However, if your data set is a sample and you want to exclude the minimum and maximum values, you should use QUARTILE.EXC function.
Are Q2 and IQR the same?
Q2 and IQR are not the same. Using the median as a substitute for the IQR can be misleading and inaccurate. The median only represents the middle value, whereas the IQR considers the lower and upper quartiles.
Related Articles
- How to Calculate Total Revenue in Excel [Free Template]
- How to Calculate Profitability Index in Excel [Free Template]
- 2 Ways to Calculate Cumulative Frequency in Excel
- Calculate Percentage of a Number in Excel [4 Cases Explained]
- Calculate 3 Types of Profit Margin in Excel
- 2 Ways to Calculate Percentage Increase in Excel
