How to Create a Clustered Column Chart in Excel
What is a Clustered Column Chart?
A clustered column chart is a type of chart that displays data in vertical bars. Each bar represents a category or group, and the height of the bar represents the value of the data. The vertical columns are independently variable, but they are represented in the grouping form as they share the same vertical label. Clustered column charts make it simple to compare data points both within and between categories.
Creating a Clustered Column Chart in Excel
Creating a clustered column chart in Excel is a relatively simple process. You can create a cluttered column chart in Excel following just a few steps.
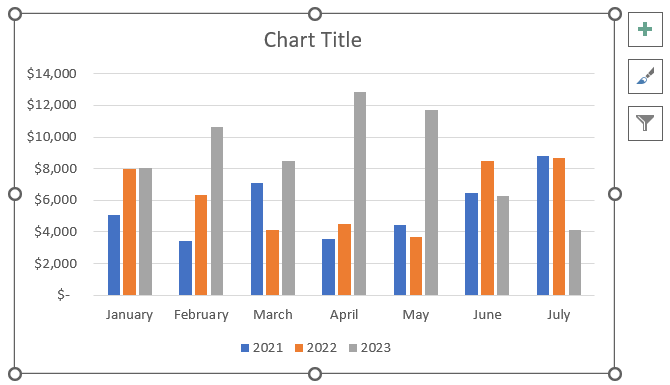
To show you how to create a clustered column chart, here I have used a three-year sales report of a small company.
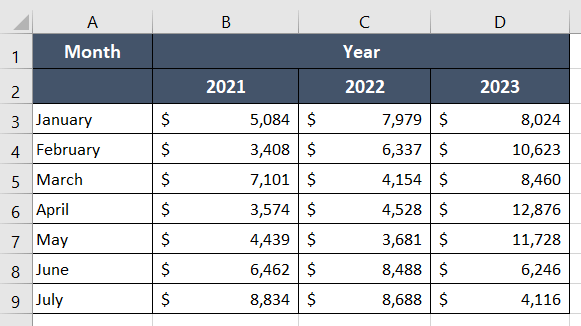
I want to compare the monthly revenue for every year. Let me show you how I do it.
Usage Guide
Step_1: First, click on any cell of the dataset and press CTRL+A to select the dataset.
Step_2: Next, click on the Insert tab from the ribbon.
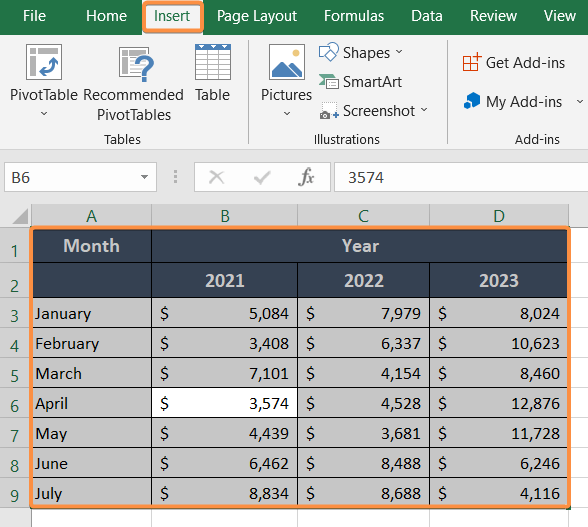
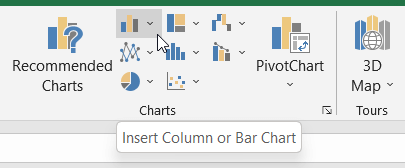
Step_3: Then, select the Insert Column or Bar Chart drop-down menu from the Charts group.
Step_4: From there, choose the first option, Clustered Column.
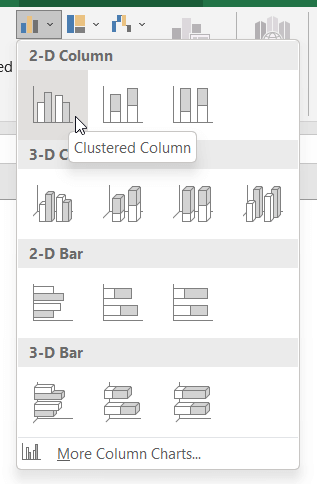
As you click on the option, the chart will show up on the worksheet.
Customizing Clustered Column Chart in Excel
Once you have created a clustered column chart in Excel, you may want to customize it to better suit your needs. There are a number of different customization options available in Excel that can be used to change the appearance and functionality of the chart.
1. Add Chart Title
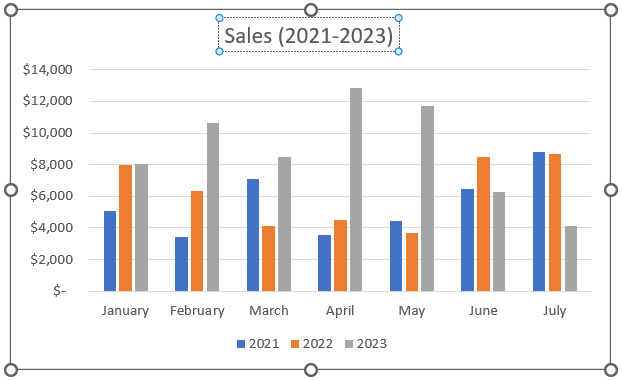
Click on the Chart Title space to add the name of the chart.
2. Add Axis Titles
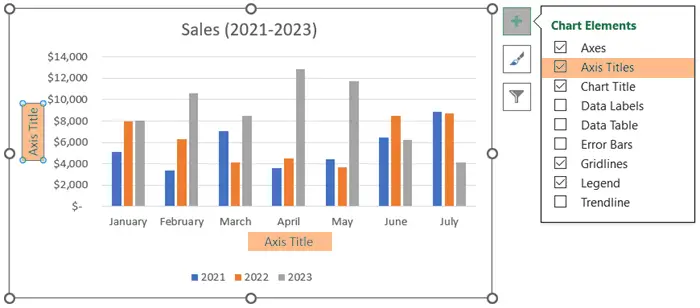
Axis titles are mandatory parts of clustered column charts. They help navigate the elements of the chart.
To add axis titles, click on the Chart Elements (+) icon and select Axis Title from the drop-down list.
3. Change Color, Font, and Size
One of the most common customization options is to change the colors of the bars in the chart.
To change the color of the bars, select a bar by right-clicking on it. Now choose a new color from the Fill options.
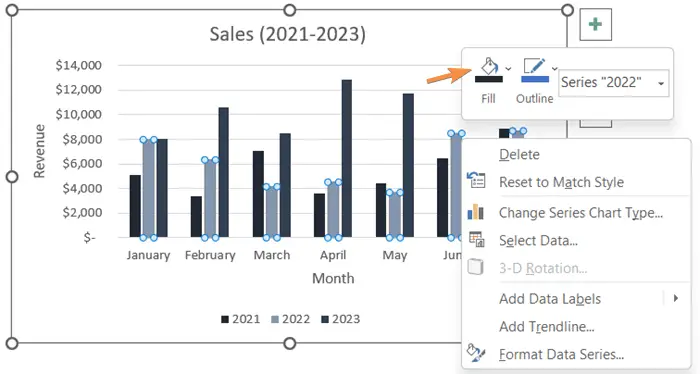
You can also change the font and size of the text on the chart this way.
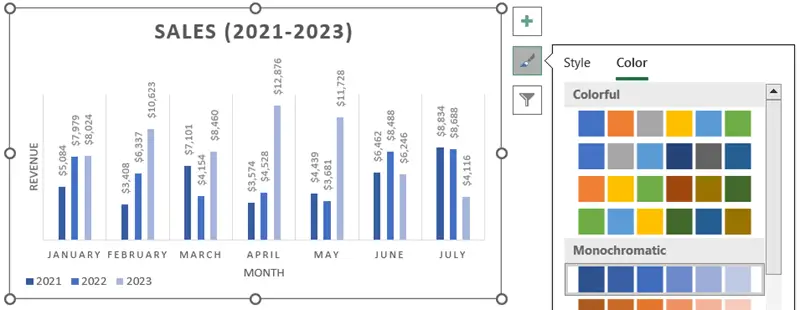
4. Add Style and Color
Another useful customization option is to add Style and Color to the chart. These options help make your clustered column chart look more creative and stylish.
Advantages of Using Clustered Column Charts
There are a number of advantages of using clustered column charts in Excel. Some of them are listed below:
- Easy to read and understand.
- Great for communicating complex data to a wide range of audiences.
- Allows for easy comparison of data points within and across categories.
- Help identify trends and patterns in the data that might not be visible when looking at the raw data.
- Help to highlight changes in data over time.
Conclusion
In conclusion, a clustered column chart is a useful tool for visualizing data in Microsoft Excel. I hope now you have a clear concept of clustered column charts and how to create them in Excel. For further queries about clustered column charts, you can comment below. Happy Excelling!
Excel Glossary | Excel Charts | Pie Chart | Bar Chart | Line Chart | Pivot Chart