5 Key Features of Pivot Table in Excel
Using Pivot Tables in Microsoft Excel is essential for anyone who knows their way around a spreadsheet. It’s a great way to turn raw data into useful insights, and it’s a powerful tool that can help you get the most out of your data analysis. Here, we’ll take a look at the top 5 features of Pivot Tables and how they can help you optimize your Excel data analysis.
1. Opportunity to Add or Remove a Field
As you apply a Pivot Table on your datasheet, you will notice the PivotTable Fields task pane on the right side of your computer screen. The PivotTable Fields task pane allows you to create a pivot table in various combinations of your columns.
Add a Field
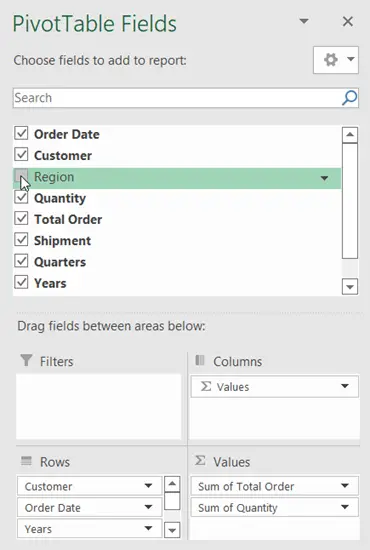
To add a field to the table, simply tick on the checkbox next to a column name in the PivotTable Fields task pane.
Remove a Field
You can remove a field from the table in two ways:
One way is to unmark the checkbox next to a column name.
Another way to remove a field from the Pivot Table:
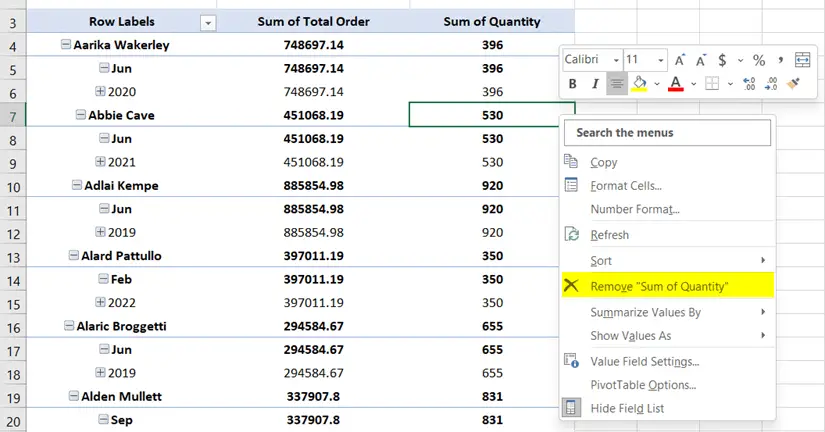
- Right-click on the field that you want to remove.
- Then remove the field name from the context menu.

2. Flexibility to Arrange the Fields
You can filter a column or find the values from a particular column. You can also turn the rows into columns and vice-versa.
To do these jobs, drag a column name with the help of the mouse and drop them into your preferred areas such as Filters, Columns, Rows, and Values.
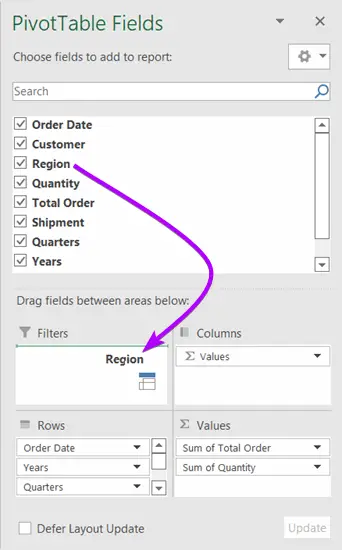
Here is an interesting thing to share. You will see the columns which contain numeric values in the Values Area. On the other hand, the non-numeric fields are inside the Rows Area.
3. Availability of Various Functions
Pivot Table by default shows the sum-up results of the numerical values using the SUM function. Microsoft Excel also designed the Pivot Table in a way that, if you drag any field from the Rows area into the Values area, the COUNT function will be activated for that field.
Apart from the SUM and COUNT functions, you can apply various useful functions like AVERAGE, MIN, MAX, PRODUCT, etc. on your table.
Steps to apply a function in Pivot Table:
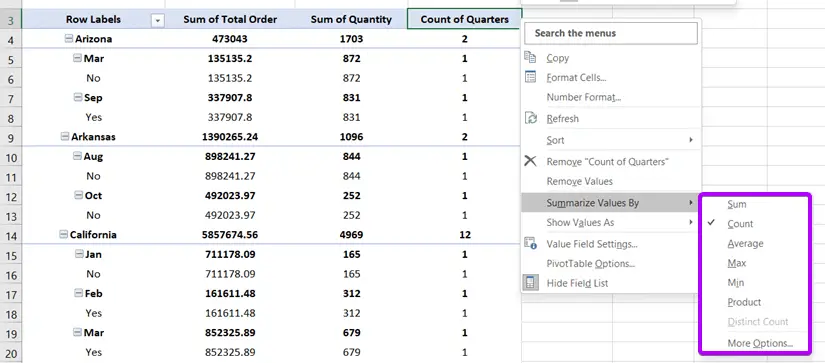
- First, right-click on your preferred numerical value field. The context menu will appear.
- Then, take the cursor on Summarize Values By option.
- Then, choose a function from the list.
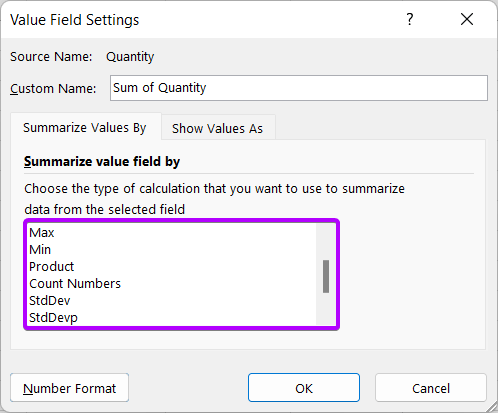
 There are also more functions available like StdDev, StdDevp, Var, Varp, etc.
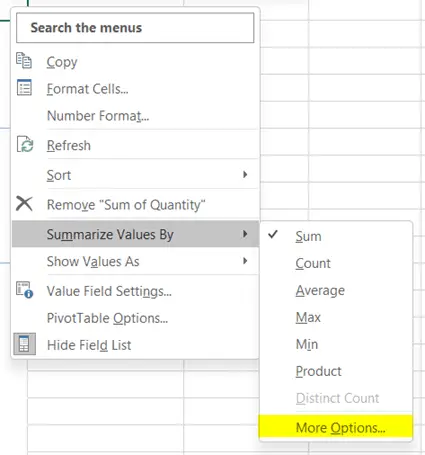
 - Click on the More Options command from the context menu.
 This will lead you to the Value Field Settings dialog box. Choose your preferred function from the function list.
4. Options to Apply Various Formats
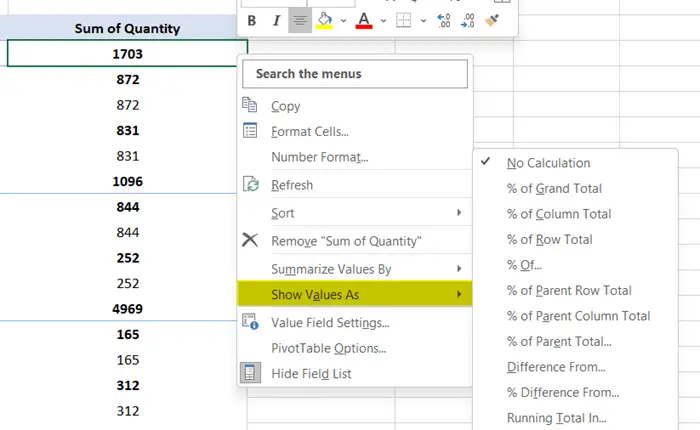
Pivot Table has some fantastic built-in options to represent the values in different ways. You can show the percentage value of various fields. Explore these features from the Show Values As command.
To apply a value format:
- First, right-click on a field that has numerical values. The context menu will show up.
- After that, take the cursor on Show Values As.
- Then, choose a command from the list.

5. Sort and Filter Any Fields
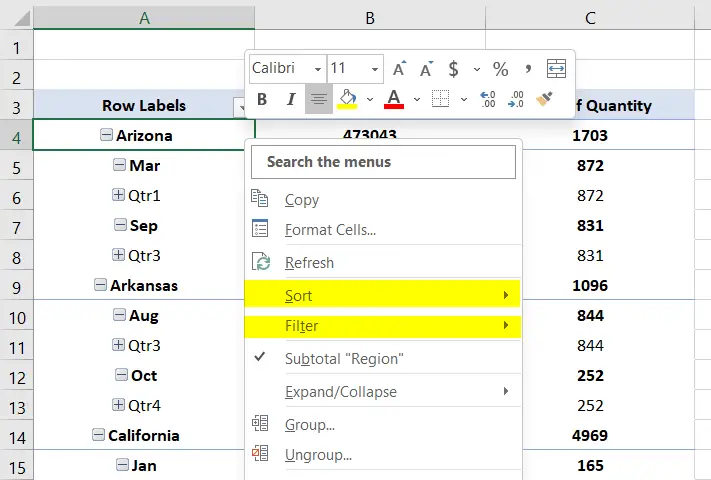
You may need to organize the table with certain criteria like smallest to latest or displaying certain fields. For that reason, Pivot Table allows you to the Sort and Filter options. To find these options, just right-click on any non-numerical field and find these options on the context menu.
Applications of Pivot Table
Pivot Tables are especially useful for data with a lot of rows and columns. For example, a table with sales data for a year might have thousands of rows and dozens of columns. Pivot Tables can be used to quickly summarize this data to show total sales for each month or average sales for each product.
The main applications of the Pivot Table are:
- Summarizes the results with subtotals and totals.
- To apply different data formats.
- Organizes unique values in a few seconds.
- Allows doing various arithmetic calculations. (counts, sums, averages, etc.)
- Generates pivot charts.
- To filter & sort the results.
- Connecting datasets outside of an Excel sheet and creating pivot reports compiling the sheets.
Conclusion
To sum up, these top Pivot Table features in Excel can help you take your data analysis to the next level. Pivot Tables provide dynamic summarization, intuitive interfaces, flexible filtering, and visual analysis to help you turn raw data into useful insights. No matter if you’re a beginner or an Excel expert, using these features in your workflow will surely improve your data analysis workflow. Get ready to dive into the Pivot Tables world and unlock the true power of Excel for actionable data-driven decisions.
Frequently Asked Questions
What are the main functions of PivotTable?
The main functions of a PivotTable in Excel include:
- Summarization: Aggregates and summarizes large datasets.
- Customization: Allows users to pivot and rearrange data dynamically.
- Filtering: Provides flexible data filtering options for focused analysis.
- Calculations: Supports various calculations like sum, average, count, and more.
- Visual Analysis: Integrates with Pivot Charts to create visual representations of data.
Are pivot tables a feature of Power Pivot?
Yes, PivotTables are a feature of both traditional Excel and Power Pivot. However, Power Pivot extends the capabilities of PivotTables by providing advanced data modeling and analysis features. Power Pivot allows users to work with larger datasets and multiple data sources, offering a more robust solution for complex data analysis tasks. While PivotTables are available in standard Excel, Power Pivot enhances their functionality for more advanced data scenarios.
What is the difference between a table and a Pivot Table in Excel?
A table in Excel is a structured range of data with headers, offering features like automatic expansion and the ability to reference data dynamically. A Pivot Table, on the other hand, is a tool used to summarize and analyze data within a table. While a table primarily organizes data, a PivotTable provides a way to aggregate and visualize that data in a more dynamic and customizable manner.
What kind of calculations can I perform within a Pivot Table?
Pivot Tables support a variety of calculations, including sums, averages, counts, percentages, and more. Users can choose from a range of functions to suit their analytical needs.
Can I change the structure of my Pivot Table easily?
Yes, one of the key features of a Pivot Table is its intuitive drag-and-drop interface, allowing users to effortlessly change the structure by moving fields between rows, columns, values, and filters.
 There are also more functions available like StdDev, StdDevp, Var, Varp, etc.
 This will lead you to the Value Field Settings dialog box. Choose your preferred function from the function list.