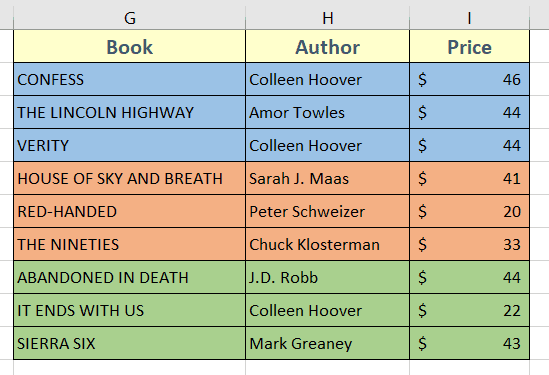
How to Sort in Excel by Color [3 Techniques]
Use the Sort Command to Sort in Excel by Cell Color
If you want to sort data in Excel based on cell color, follow the steps below:
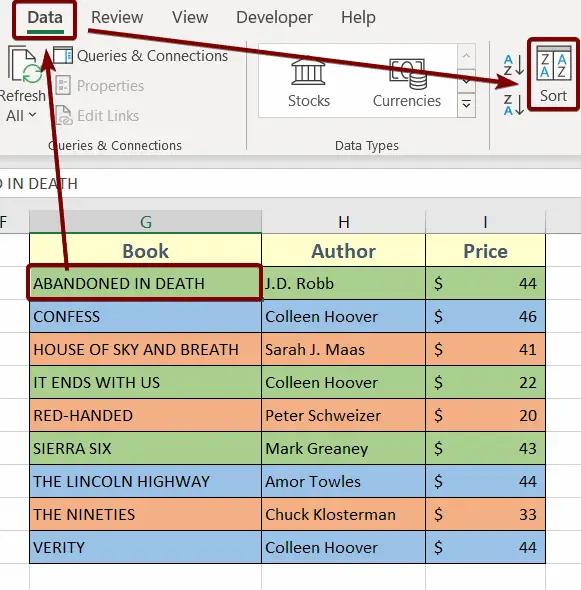
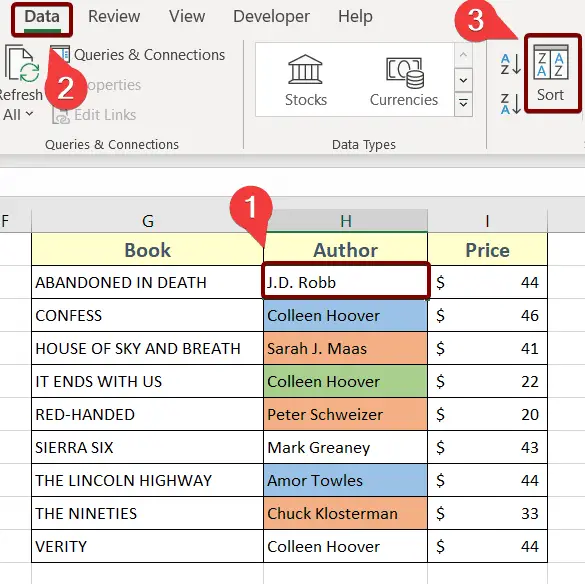
- Click on any cell of your dataset.
- Go to the Data tab and click on the Sort button.
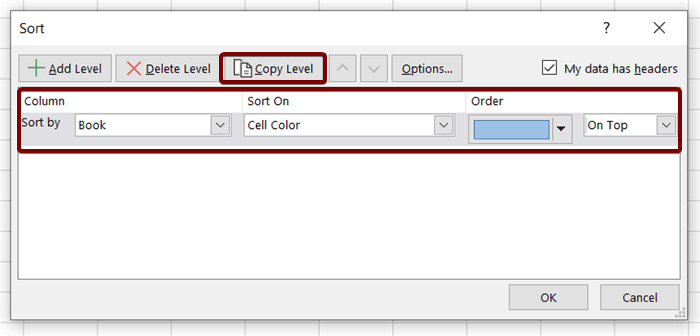
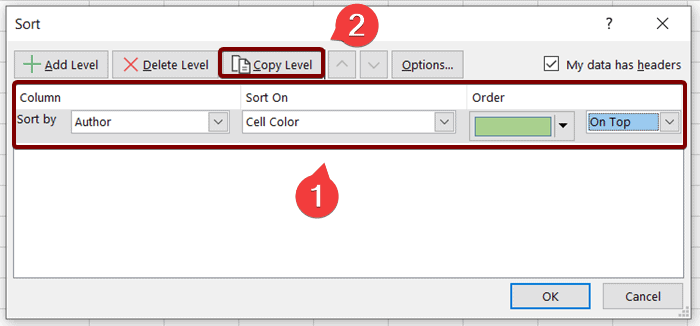
 The Sort dialog box will appear.
 - Under the Column section, select the name of the column to sort based on that column’s data.
For this instance, I’m selecting the column “Author”. Because I want to sort based on the cell colors of this column. - From the Sort On section, select Cell Color.
- In the Order section, select the cell color that you want to keep at the top.
I’m selecting the Green color for now. - After that click on the Copy Level button.
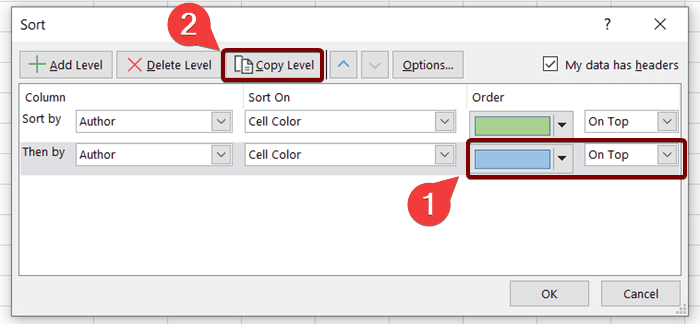
This will copy the setting that you’ve just set and create another level for you.
You can also click on the Add Level button. But that will create a brand new level and you have to tweak the settings from scratch then.

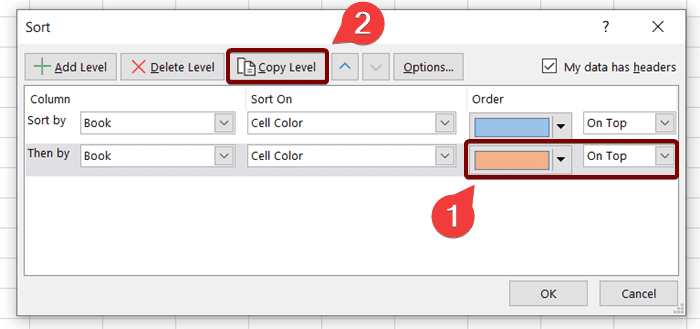
- In the copied layer, select another cell color and click on the Copy Level again.

- This time, select the next cell color that you want to keep after your previous selection of cell colors.
Then, continue this process until you are done with all the cell colors. - After making the order of all the cell colors, hit the OK button.
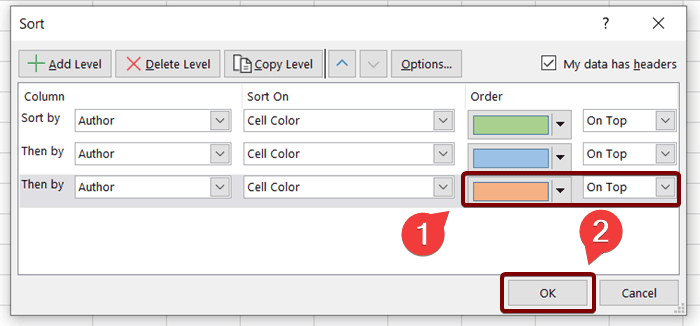
Now you will have your data sorted by their cell colors as in the picture below:
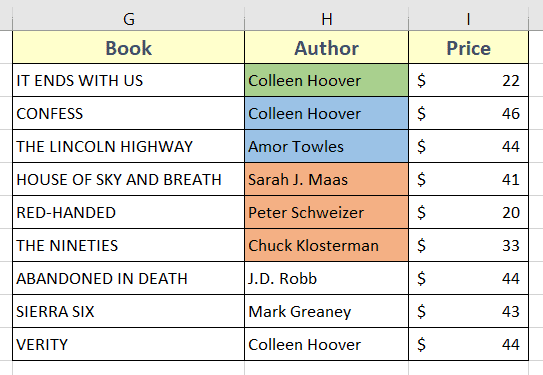
Sort in Excel by Font Color
If you have data with various font colors and want to sort them according to their font colors, then proceed with the following steps.
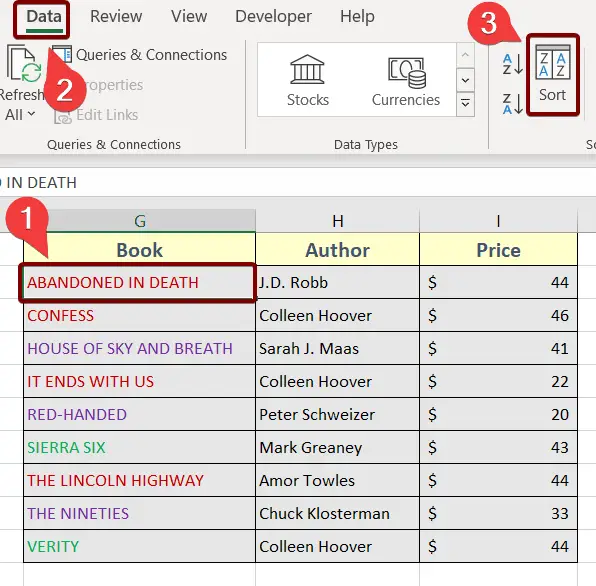
- First of all, select any cell of your data table.
- Then go to Data > Sort.
 The Sort dialog box will appear.
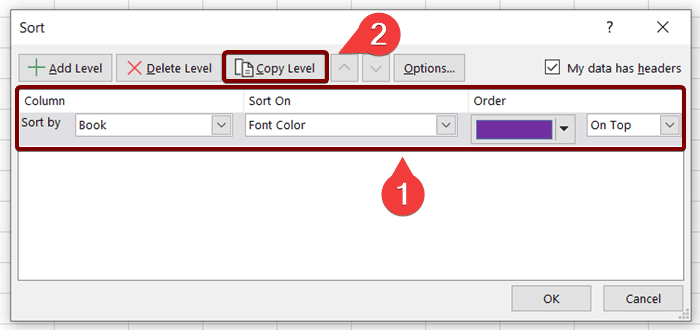
 - Select the column name to sort based on its font colors in the Column section.
- Choose a Font Color in the Sort On section.
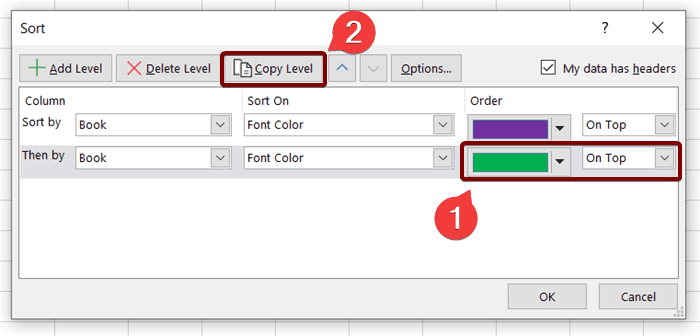
- Then choose a font color from the Order section and hit the Copy Level button.

- Select another font color in the copied level and hit the Copy Level button again.

- Choose another font color in the copied level and continue this process until you are done choosing all the font colors.
- Finally hit the OK button.
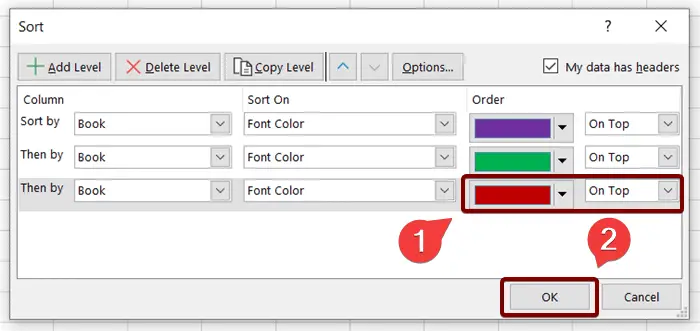
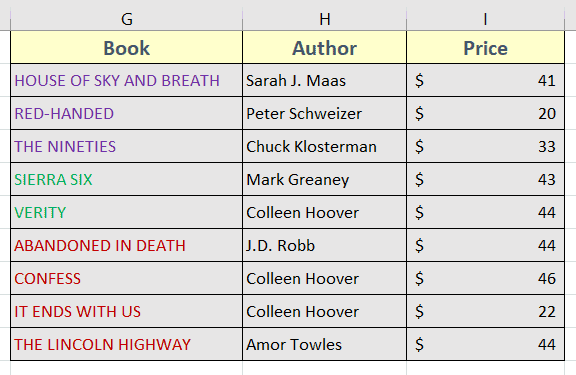
Now, your data will be sorted based on their font colors as in the picture below:
- How to Sort Multiple Columns in Excel (4 Techniques)
- How to Sort in Excel by Name (3 Techniques)
- How to Sort by Number in Excel (4 Techniques)
Sort in Excel by Color with Conditional Formatting Command
The usage of Conditional Formatting icons is one of the convenient ways to format data based on their properties. Excel allows sorting data based on Conditional Formatting colors.
If you are looking for ways to sort your data based on the Conditional Formatting icons, follow the steps below:
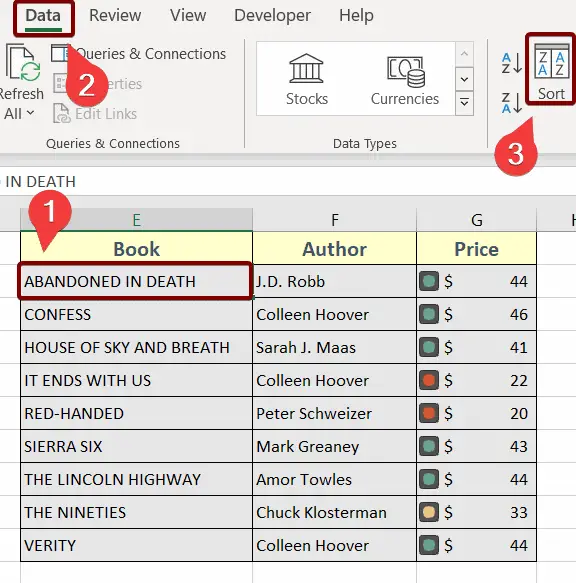
- Click on any cell of your dataset.
- Then, go to the Data tab and hit the Sort button.

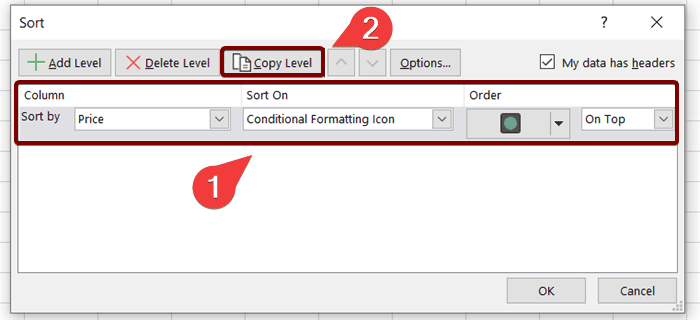
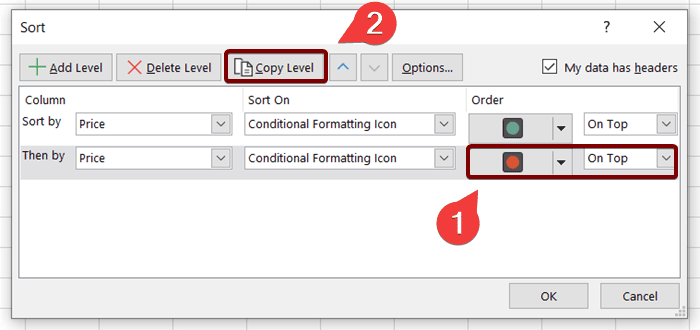
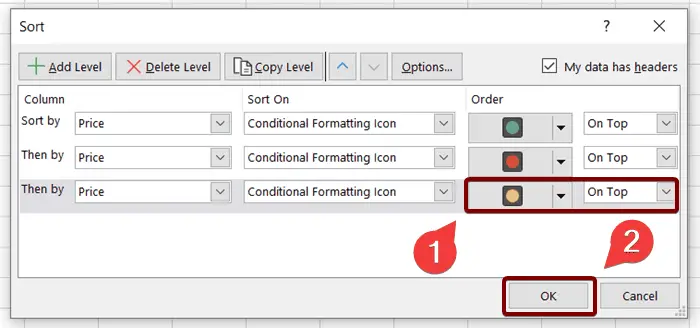
- Select the name of the column in the Column section where the Conditional Formatting icons are.
- Then move on to the Sort On section and choose the Conditional Formatting icon.
- In the Order section, choose the first Conditional Formatting icon that you want to put on the top.
- Then hit the Copy Level button.

- Select another Conditional Formatting icon in the copied level.
- Then hit the Copy Level button again.

- Go ahead with selecting another Conditional Formatting icon and continue this process until all the icons are selected.
- Finally hit the OK button to see the changes.
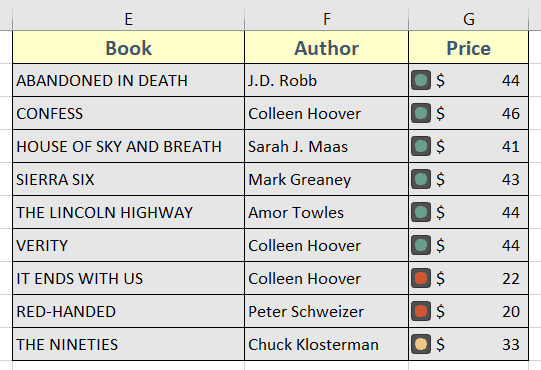
Finally, you will see your data sorted as per the Conditional Formatting icons just like in the picture below:
How to Sort Rows by Color in Excel
If you have rows with different colors, you can easily sort them based on the row colors. Now, follow the steps below to sort rows by color in Excel:
- First of all, click on any row to select.
- Then go to the Data tab and hit the Sort button.
 The Sort dialog box will appear.
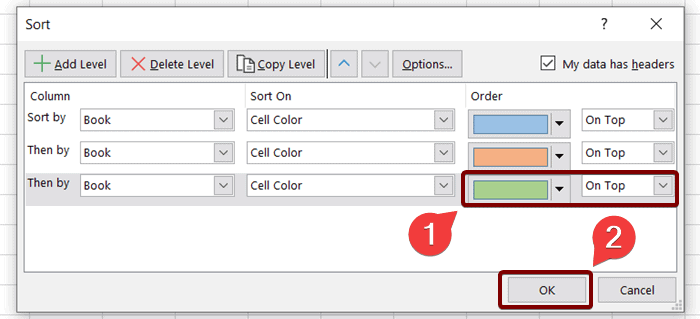
 - Now select any column name in the Column section.
- Select Cell Color from the Sort On drop-down.
- From the Order drop-down, select any row color that you want to keep at the top.
- After that hit the Copy Level button.

- Then choose another row color from the Oder drop-down and hit the Copy Level button again.

- Choose the next row color that you want to keep after your previous selections of row colors.
Now continue this process on and on until you are done sorting all the row colors. - Finally hit the OK command to apply changes.
After that, you will see your rows sorted by color just like in the picture below:
Conclusion
In this article, I’ve discussed sorting techniques in Excel based on cell color, font color, and conditional formatting icons. Feel free to comment on anything regarding the topic. I will try to respond as soon as possible.
Frequently Asked Questions
Why can’t I sort by color in Excel?
Excel’s native sorting functionality does not directly support sorting by cell color. However, you can achieve sorting by color through a workaround:
- Add a Helper Column: Add a new column next to your data.
- Use Conditional Formatting: Apply different colors based on the criteria you want to sort.
- Sort Based on the Helper Column: Sort the data based on the values in the helper column.
This indirect method allows you to sort data by color in Excel. Keep in mind that Excel might have introduced new features or changes since my last update, so it’s a good idea to check the latest Excel documentation for any updates on this functionality.
How do I filter by color in Excel?
In Excel, you can filter data by color using the following steps:
- Click on a cell within the data range.
- Click on the Data tab in the Excel ribbon.
- In the Sort & Filter group, click on the Filter button. This will add filter arrows to the headers of your selected range.
- Click on the filter arrow in the column header.
- Hover over “Filter by Color” in the dropdown menu.
- Choose the color you want to filter by. Excel will filter the data to display only the rows with cells matching the selected color.
By following these steps, you can easily filter data based on cell colors in Excel.
What is the formula for colored cells in Excel?
In Excel, there isn’t a specific formula for colored cells. The color of a cell is determined by formatting, not by a formula. However, you can use conditional formatting to apply colors based on specific conditions. To apply conditional formatting:
- Select the cell or range of cells.
- Go to the Home tab.
- Click on Conditional Formatting in the toolbar.
- Choose the desired rule, such as Highlight Cells Rules or New Rule.
- Set the conditions and choose the formatting options, including color.
Conditional formatting allows you to automatically apply colors to cells based on the values or criteria you specify. There isn’t a single formula for colored cells; rather, you use conditional formatting rules to achieve the desired visual representation in Excel.
 The Sort