Pivot Table Cheat Sheet for Excel [Free PDF Download]
Download Pivot Table Cheat Sheet in PDF

Create a Pivot Table
Select the data range and go to Insert tab > Pivot Table.
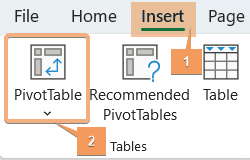
Keyboard Shortcut Keys: ALT+N+V+T
Refresh Pivot Table
Click anywhere in the Pivot Table and go to PivotTable Analyze tab > Refresh command. Or, right-click and select Refresh command.
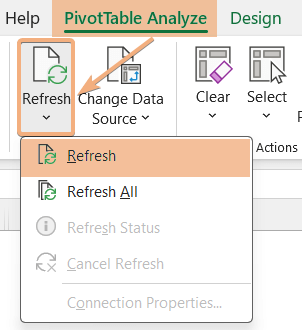
Keyboard Shortcut Keys: ALT+F5
Drill Down to Audit Data in Pivot Table
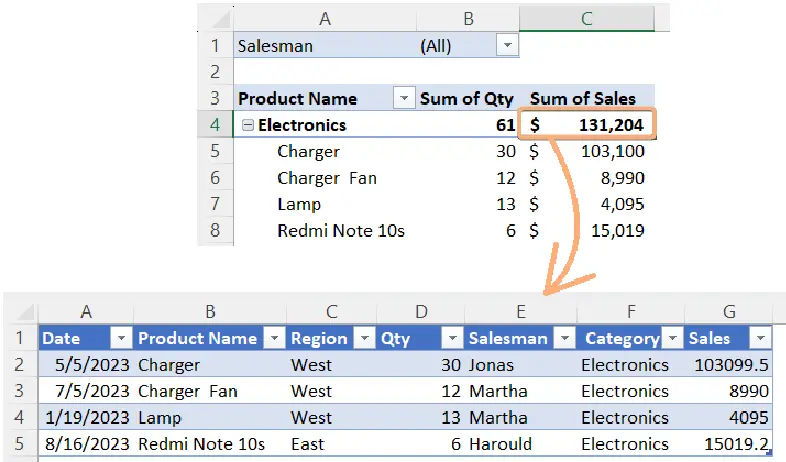
Double-click on a data within the Pivot Table.
Change Pivot Table Range
Click on any cell inside the Pivot Table. Then, navigate to PivotTable Analyze tab > Change Data Source option and select the new data range.
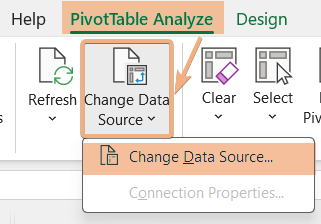
Keyboard Shortcut Keys: ALT > J > T > I >D
Clear, Select & Move PivotTable
Click a cell in the Pivot Table. Now, go to the PivotTable Analyze tab and then the Actions group to access the Clear, Select, and Move PivotTable tools.
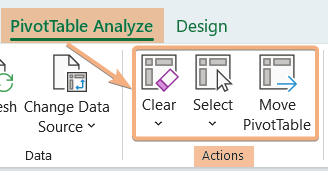
Keyboard Shortcut Keys:
- Clear PivotTable: ALT+JT+E
- Select PivotTable: ALT+JT+W
- Move PivotTable: ALT+JT+V
Delete a Pivot Table
Click on the Pivot Table, then go to Select dropdown > Entire PivotTable option and press the DELETE key.
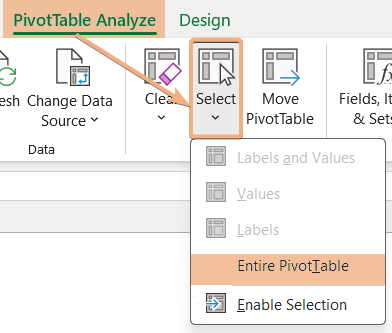
SKeyboard Shortcut Keys: ALT+J+W+T & press the DELETE key.
Calculated Field in Pivot Table
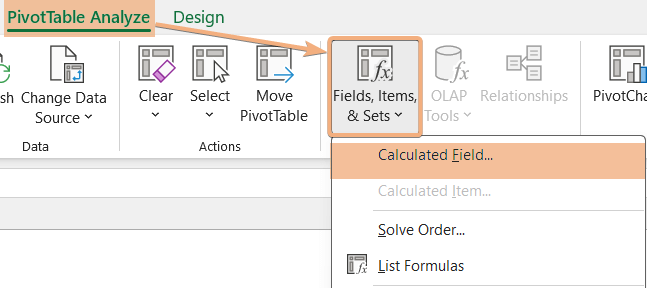
Hit on a cell in the Pivot Table. Then, go to PivotTable Analyze tab > Fields, Items & Sets dropdown> Calculated Field option.
PivotTable Styles
Click anywhere inside the Pivot Table. Now, navigate to the Design tab > PivotTable Styles group.
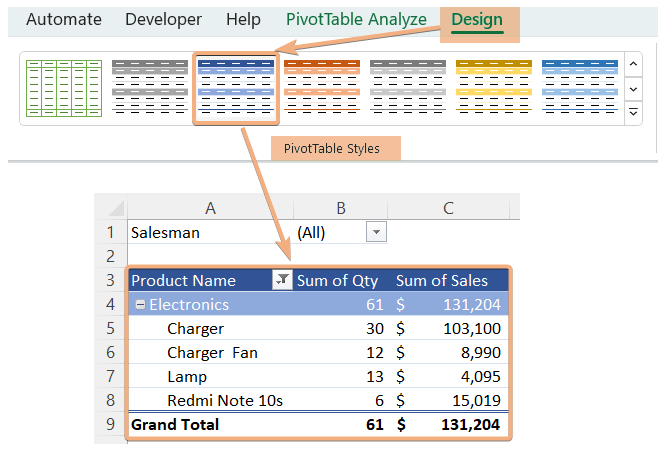
Keyboard Shortcut Keys: ALT+JY+S
Conditional Formatting in Pivot Table
To highlight values in the Pivot table, go to Home tab > Conditional Formatting dropdown.
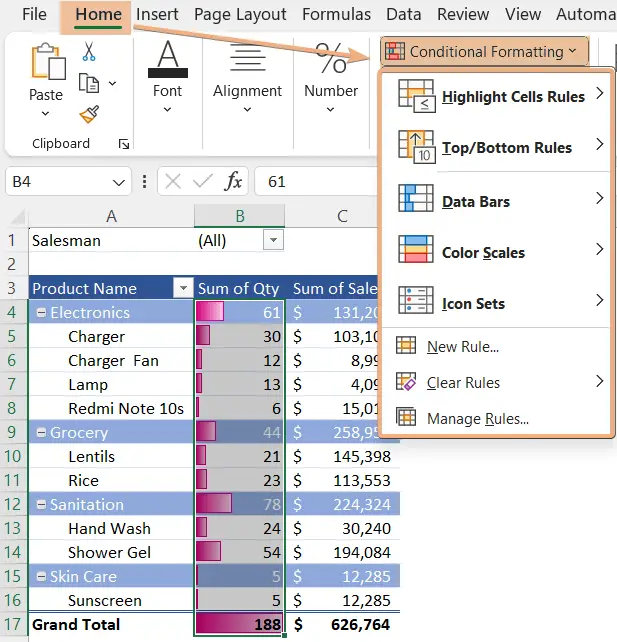
Keyboard Shortcut Keys: ALT > H > L
Number Formatting in Pivot Table
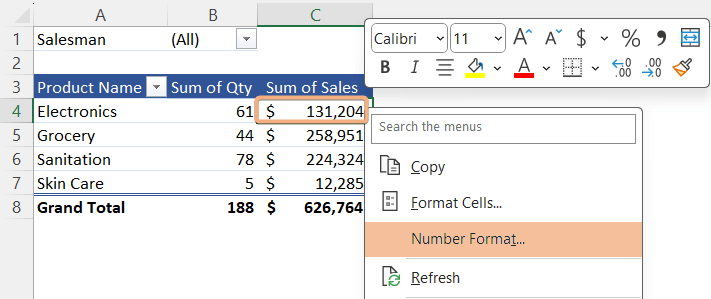
To format value in the Pivot Table, right-click on that value and choose the Number Format.
Subtotals/Grand Totals in Pivot Table
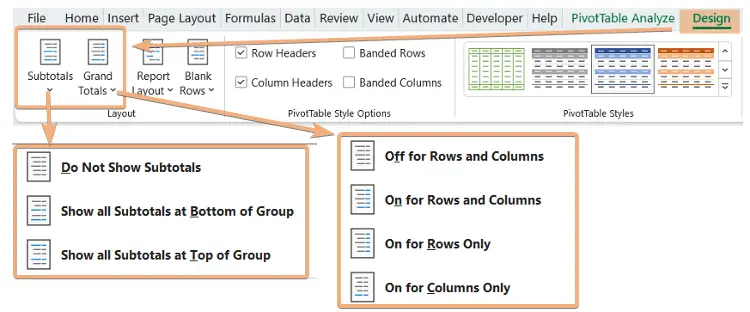
Hit a cell within the Pivot Table and go to the Design tab > Layout group. Then, choose the options to insert or remove from Subtotals and Grand totals.
Keyboard Shortcut Keys:
- Subtotals: ALT+JY+F
- Grand Totals: ALT+JY+H
Report Layout & Blank Rows in Pivot Table
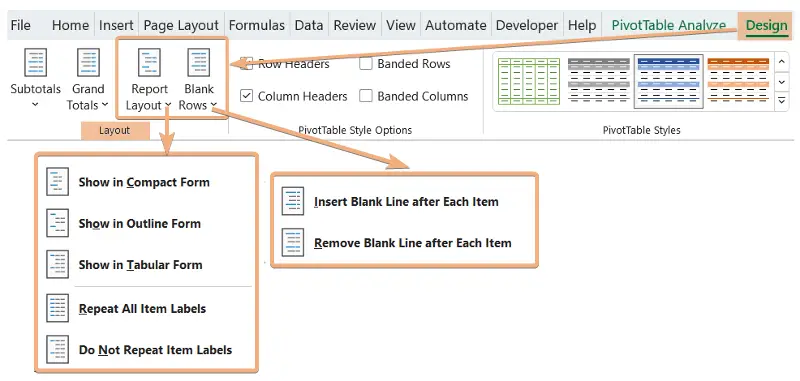
To access Report Layout and Blank Rows, click a cell in the Pivot Table and navigate to Design tab > Layout group.
Keyboard Shortcut Keys:
- Report Layout: ALT+JY+N
- Blank Rows: ALT+JY+P
Access PivotTable Options
Select any cell inside the Pivot Table, then right-click on that and choose PivotTable Options. Or, after clicking on a cell, go to PivotTable Analyze tab> Options.

Keyboard Shortcut Keys: ALT > JT > T > T
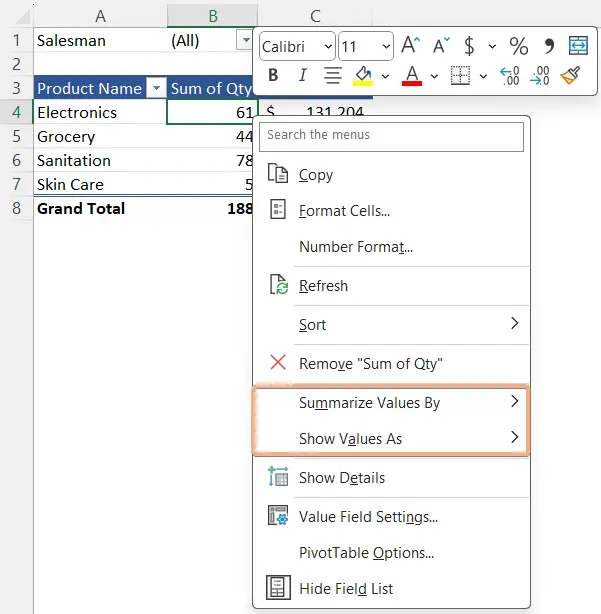
Summarize Value By/Show Value As
Click on a cell and right-click on that, then choose Summarize Values By or Show Values As.
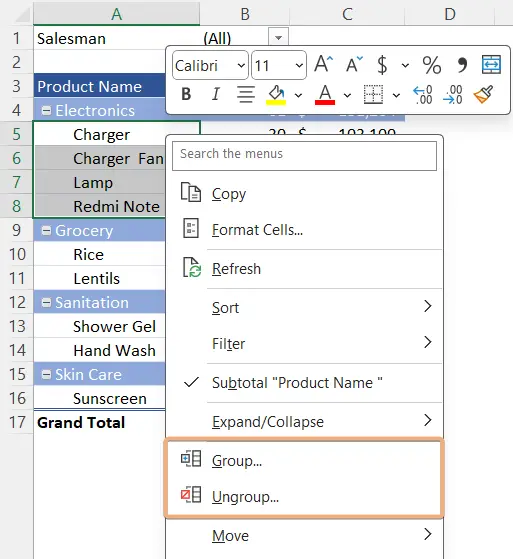
Grouping/Ungrouping
Right-click on any cell in the first column in the Pivot Table and choose Group or Ungroup.
Sorting in Pivot Table
Select a cell and right-click on that, then, select Sort and choose Sort options.
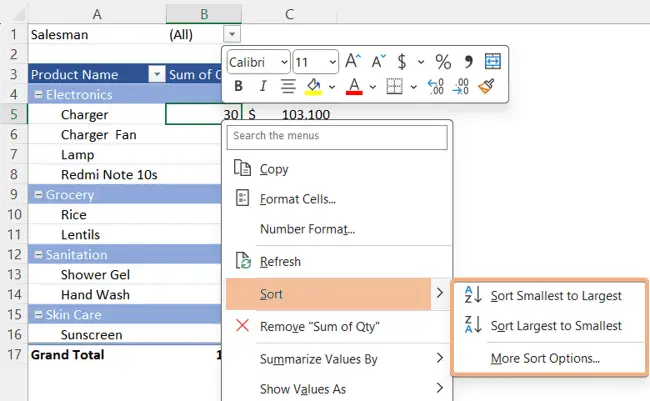
Keyboard Shortcut Keys: ALT+A+SS
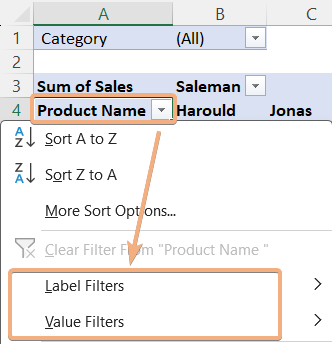
Filtering in Pivot Table
Click on the dropdown of Row Labels/Column Labels and choose Filters options in Pivot Table.
Insert Slicers in Pivot Table
Select any cell in the Pivot Table and go to PivotTable Analyze tab > Insert Slicer tool.
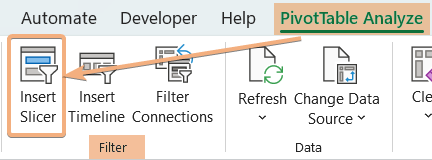
Keyboard Shortcut Keys: ALT>JT>SF
Insert Timeline in Pivot Table
Click anywhere in the Pivot Table and go to PivotTable Analyze tab> Insert Timeline tool.
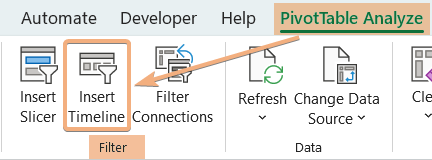
Keyboard Shortcut Keys: ALT>JT>ST
Activate GetPivotData
Select any cell in the Pivot Table and then, navigate to the PivotTable Analyze tab > Options > Generate GetPivotData option.

Keyboard Shortcut Keys: ALT>JT>T>G
Insert Pivot Chart
Select the data range and go to Insert tab > PivotChart dropdown > PivotChart & PivotTable option.

Keyboard Shortcut Keys: ALT > N > SZ > P
Conclusion
Mastering the art of Pivot Tables in Excel opens up a world of possibilities for efficient data analysis. This cheat sheet serves as a handy reference guide to unleash the full potential of Pivot Tables, helping you make informed decisions and gain valuable insights from your data. Take your Excel skills to the next level and transform raw data into meaningful narratives with the power of Pivot Tables.
Frequently Asked Questions
What is an Excel Pivot Table, and how does it work?
An Excel Pivot Table is a powerful data analysis tool that allows you to summarize, organize, and manipulate large datasets easily. It works by dynamically reorganizing and aggregating data, providing a flexible way to analyze information and extract meaningful insights.
Are there any prerequisites for using Excel Pivot Tables?
While a basic understanding of Excel is helpful, Pivot Tables are designed to be user-friendly. With our cheat sheet and a willingness to explore, you can quickly grasp the essentials and unlock the potential of Excel Pivot Tables for efficient data analysis.
Can I customize the appearance of my Pivot Table?
Absolutely. You can customize your Pivot Table’s appearance by adjusting the formatting options, changing the layout, and applying styles. Right-click on various elements within the Pivot Table to access formatting and customization options.
What functions can I use within a Pivot Table?
Pivot Tables support various functions such as SUM, COUNT, AVERAGE, and more. These functions help you aggregate and summarize your data, providing valuable insights into the key metrics of your dataset.
Can I update my Pivot Table with new data?
Yes, you can easily update your Pivot Table with new data. Right-click on the table, and select “Refresh.” Excel will automatically incorporate the latest information, ensuring your analysis is always up-to-date.
What are Calculated Fields, and how do I use them?
Calculated Fields allow you to perform custom calculations within your Pivot Table. For instance, you can create a calculated field to find profit margins or any other custom metric by applying formulas to your existing data.
How can I visualize my Pivot Table data with charts?
To visualize your Pivot Table data, pair it with a Pivot Chart. Highlight your Pivot Table, go to the “Insert” tab, and choose the desired chart type. This dynamic combination provides a visual representation of your data, making it easier to identify trends and patterns.