4+ Methods to Filter Duplicate Values in Excel
Having duplicate values in a worksheet can lead to some inconveniences. It can take you a lot of time to find out the identical values manually. Microsoft Excel has great tools to find duplicate values in various ways. After that, the duplicates can be removed to clean up the dataset. I am going to show you 4+ easy methods to filter duplicate values in Excel.
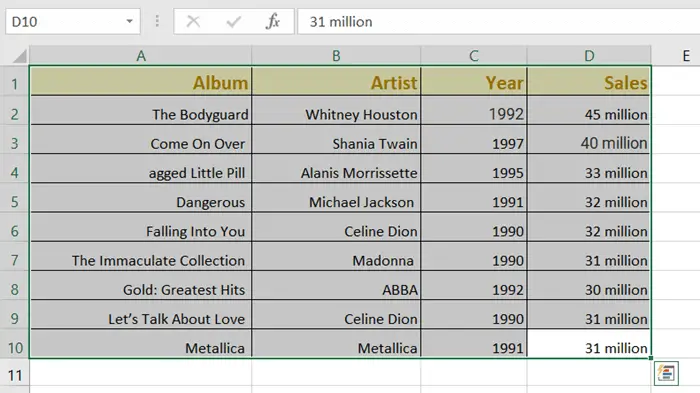
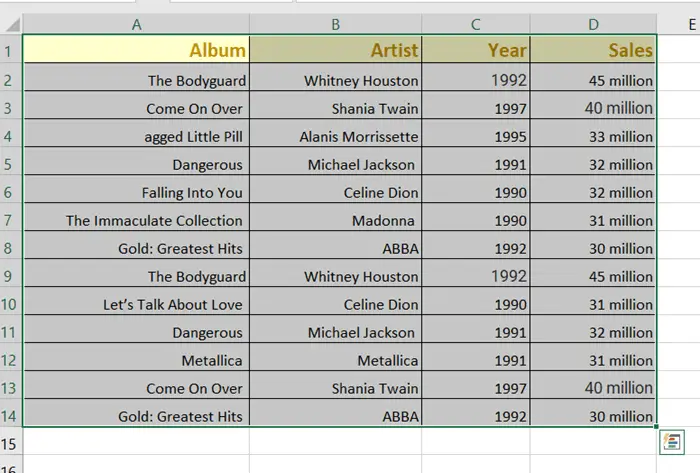
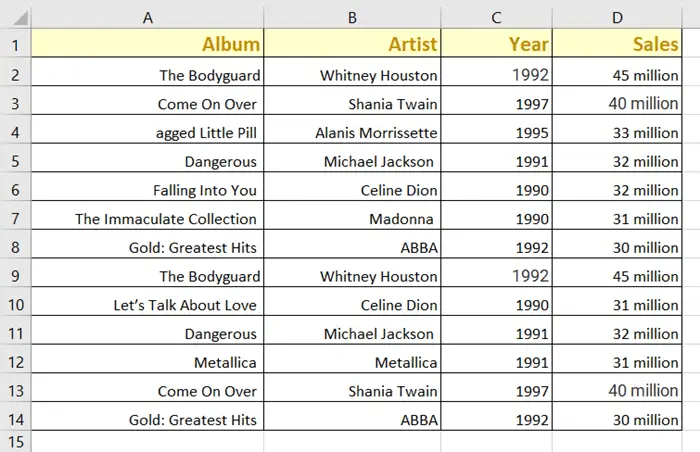
Let me introduce you to the datasheet used throughout this article. The dataset I have used for showing the methods has 4 columns about some of the best music albums, artist names, years, and their sales records.
Filter Duplicate Values in Excel with Remove Duplicates Command
The quickest and easiest way to filter out the duplicate values from a dataset is to use the Remove Duplicates command.
So, use Remove Duplicates command to filter duplicate values, follow these steps:
- Select the entire data table.

- Click on the Data tab from the ribbon.
- Then, select the Remove Duplicates command from the Data Tools group.
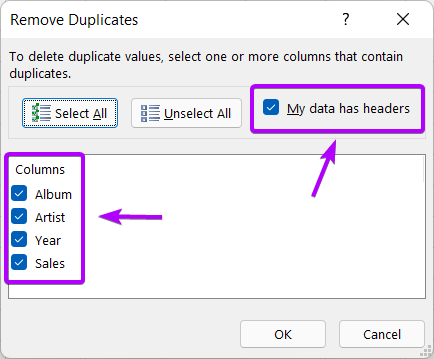
 The Remove Duplicates dialog box will show up on the screen.
 - Make sure all the Column boxes are selected. Also, check the tick mark on My data has headers box.

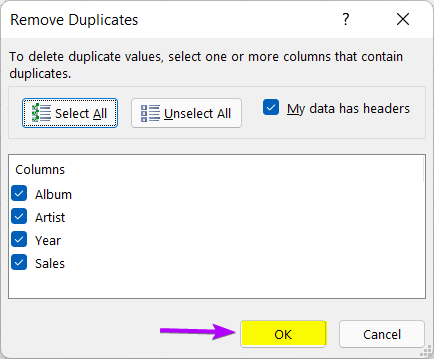
- Hit OK to take away all the similar values.

A window will show up to display short description of number of values are erased and kept.

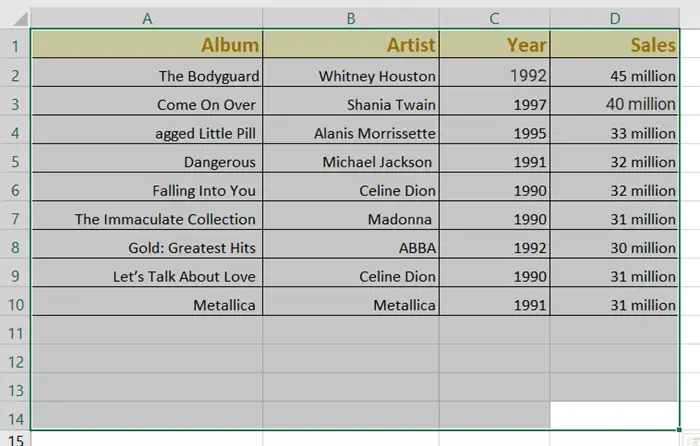
After clicking OK, you will see the filtered duplicates with Remove Duplicates command.
Filter Duplicate Values in Excel Using Advanced Option
Another way to filter the duplicates is using the Advanced Filter. The Advanced Filter can filter out data on different criteria. Now, to do that, go through the procedure:
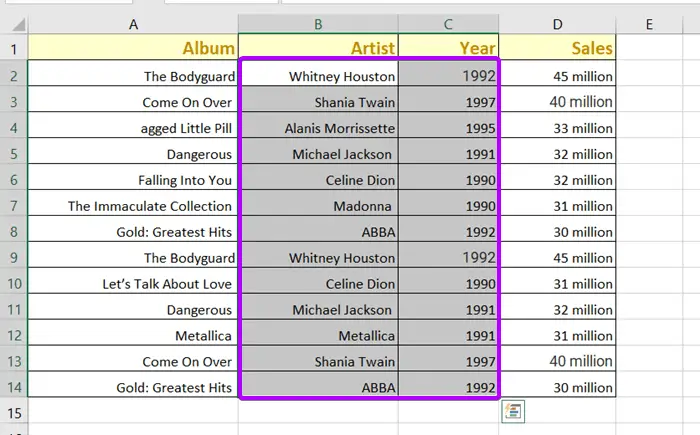
- Select a particular range of values that you want to filter.
I am choosing the Artist and Year columns for that.

- Click on the Data tab from the ribbon.
- Under the Sort & Filter group, hit the Advanced option.
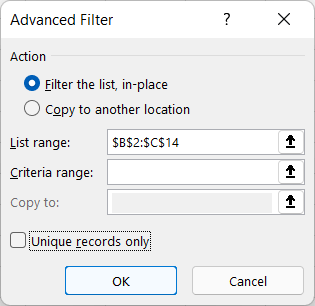
 You will see the Advanced Filter Dialog box will appear.

- Choose either Filter the list, in-place, or Copy to another location as an Action type. I have chosen the Filter the list, in-place.
- Keep the Criteria range empty.
- The Copy to box will seem default if you choose the Filter the list, in-place option. But you have to fill up the Copy to box if you choose the Copy to another location option.
- Give a tick mark on the Unique record only check box and hit OK.
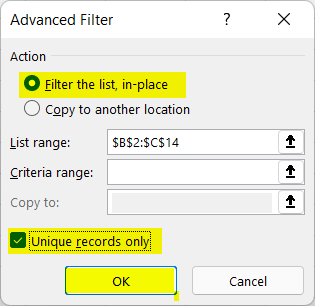
Now, you will see the filtered duplicate with Advanced filter option.
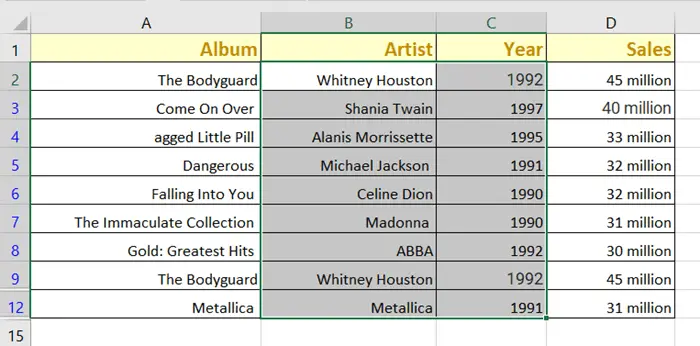
Even if I chose two columns, you can see the duplicate valued rows are gone now. It’s because my selected columns contained repeated values. So, the whole dataset had to filter out.
- 5 Ways to Find Matching Values in Two Worksheets in Excel
- How to Find Similar Text in Two Columns in Excel (5 Ways)
Filter Duplicate Values in Excel Applying Pivot Table
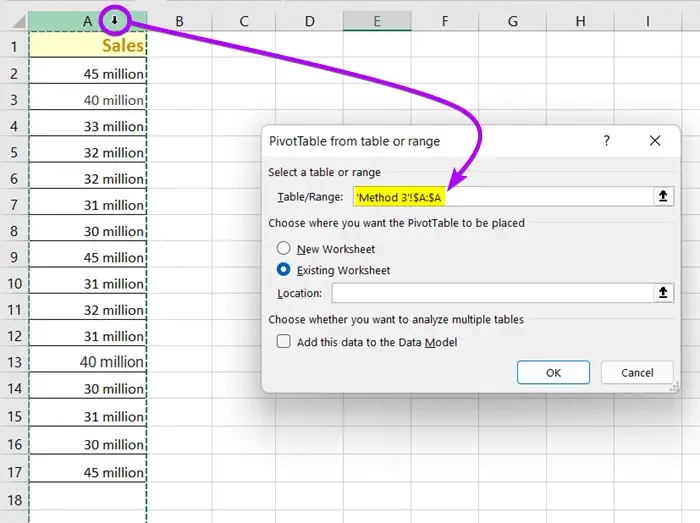
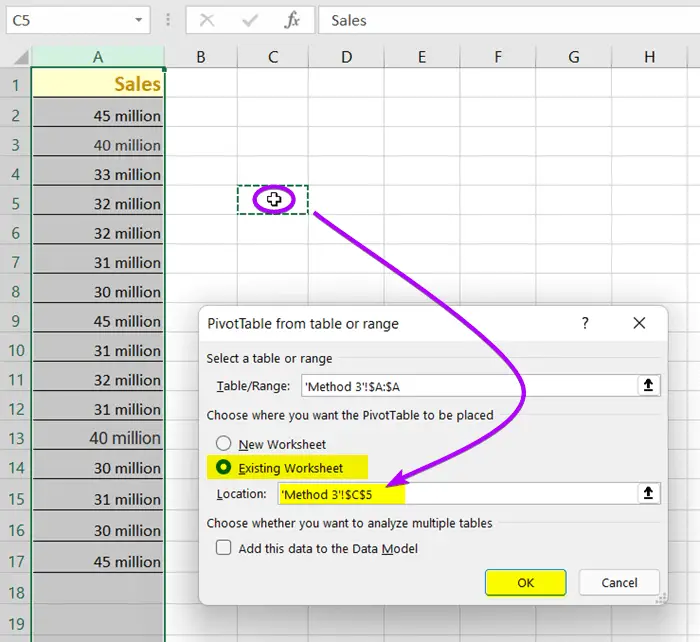
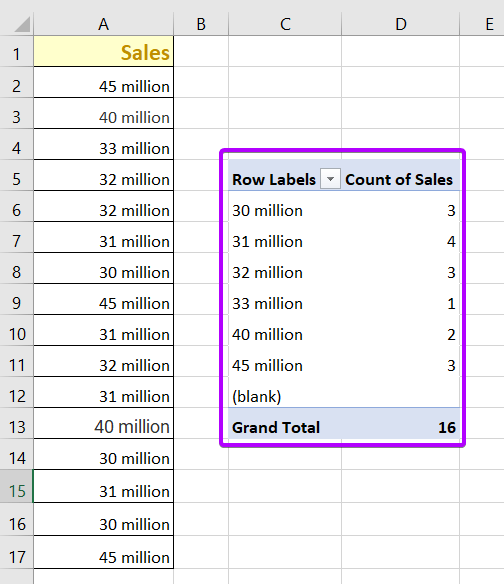
Pivot Table is sort of an analytics tool to count the number of items. First, I am going to show you using Pivot Table to find duplicate values for a single-column dataset. And then, I will show the instruction steps for a multiple-column dataset. Here is one-columned table for company’s sales records.
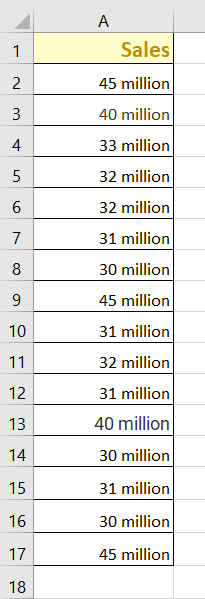
Pivot Table for Single Column Dataset in Excel
Now, follow these steps to apply Pivot Table in Excel:
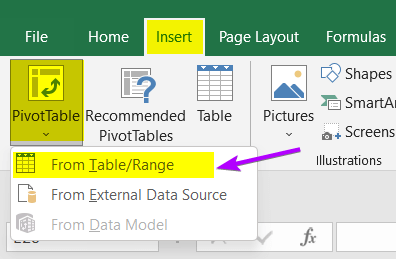
- Go to Insert tab from the ribbon.
- Under the Tables group, select the PivotTable drop-down menu.
- Click on From Table/Range command.
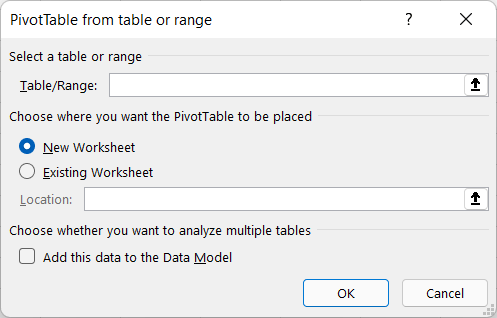
 A dialog box named PivotTable from table or range will pop up.

- Click on Column A to select the range.

- Choose the Existing Worksheet option.
- Select a suitable spare cell for the Pivot Table’s Location and click on it and hit OK.
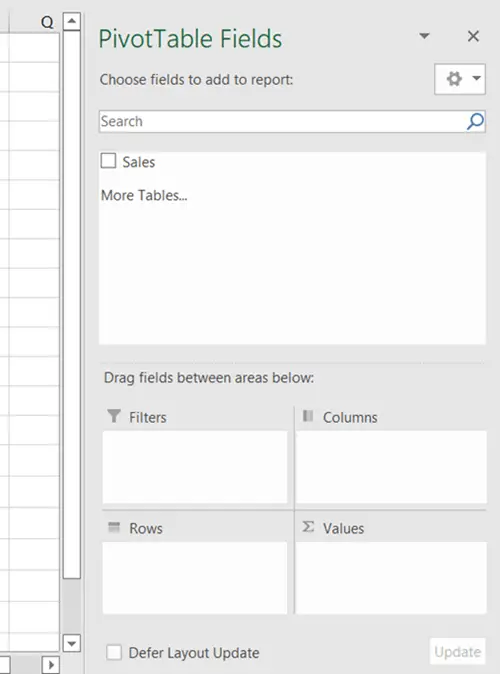
 PivotTable Fields pane will come up on the right side of your worksheet.
 Marking the Sales column will automatically shift in the Rows section. I have dragged the Sales in the Values section.
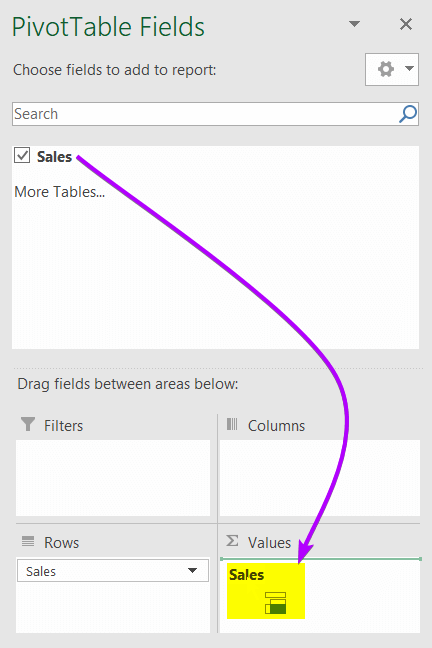
The Values command will add the total numbers of identical values.

All the repeated values are gone now in a separate table with the cell repetition counts.
- 5+ Formulas to Find Duplicates in One Column in Excel
- How to Compare Rows in Excel for Duplicates (7 Ways)
Pivot Table for Multiple Column Dataset in Excel
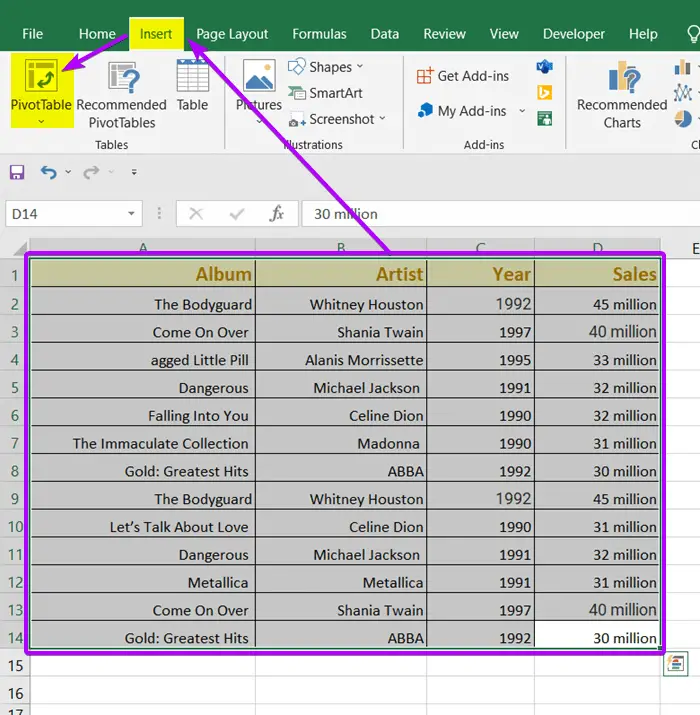
To insert Pivot Table for multiple column dataset in Excel, go through the steps below:
- Select the entire data table.
- Click on the Insert tab.
- Under the Tables group, select the PivotTable command.
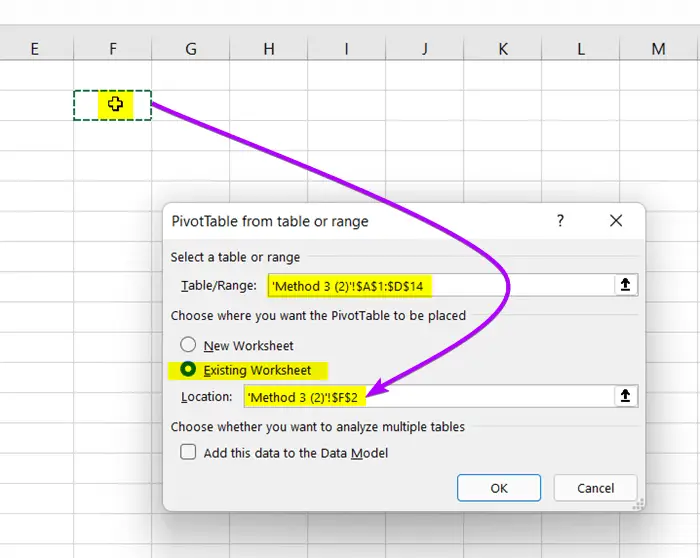
 A dialog box named PivotTable from table or range will pop up.
 - Choose the Existing worksheet point from Choose where you want the Pivot Table to be placed bar.
- Click on the Locations bar, and now select an empty cell beside the table.

- Press OK from the box.
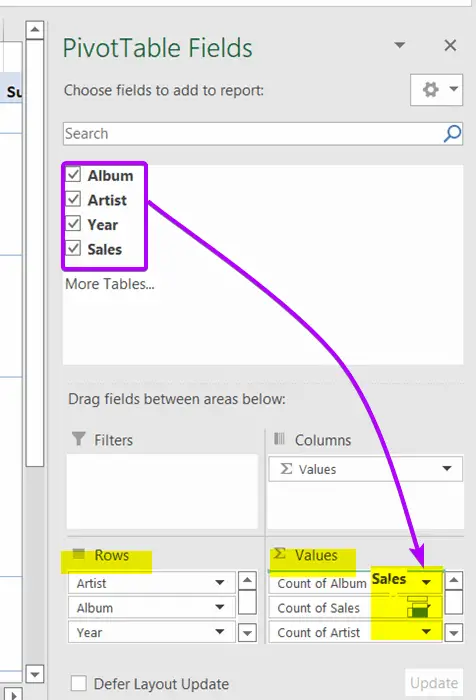
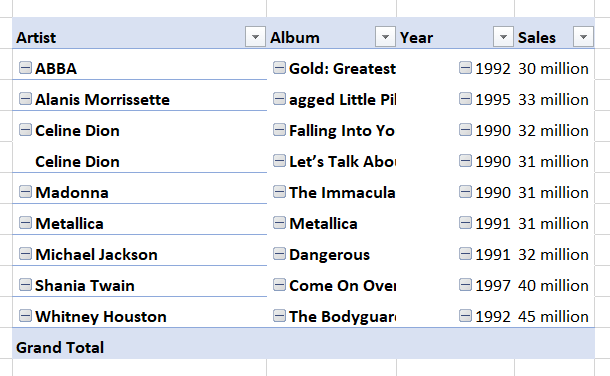
The PivotTable Fields window will come up on the right side of your worksheet. - Mark all the checkboxes (Album, Artist, Year, Sales) to add them inside the Rows section.
- Drag the checkboxes inside the Values section one by one from above.

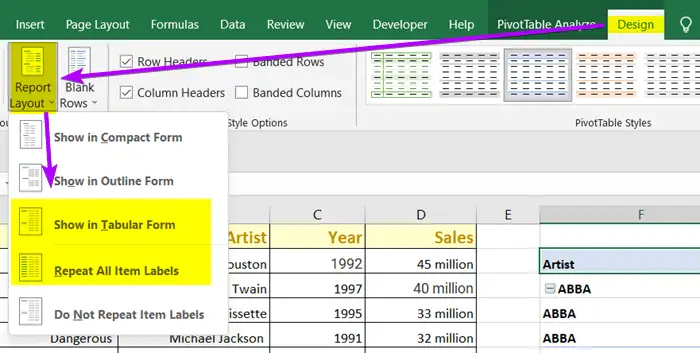
- Now hit the Design tab.
- Under the Layout group, click on the Report Layout drop-down.
- Select “Show in Tabular Form“, and “Repeat All Item Labels” command.

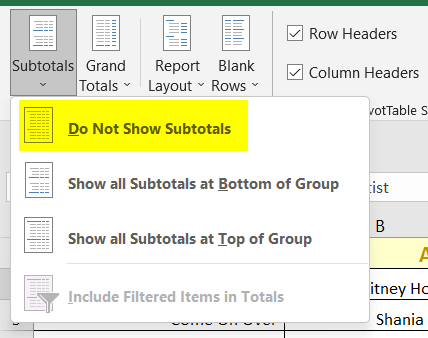
- Under the Layout group, hit the Subtotals drop-down menu.
- Select the Do Not Show Subtotals command.
The Pivot Table can filter out the duplicate values from both the single-column data table and the multiple-columned data tables. It will show the results in a separate table.
- Find, Highlight, and Remove Duplicates in Excel [Step-by-Step]
- How to Remove Duplicates in Excel [13 + Different Methods]
Filter Duplicate Values in Excel with Power Query Editor
Power Query is known for transforming data differently. Power Query Editor can also do the work of filtering and erasing identical values.
Here are the steps to filter duplicate values in Excel:
- Select the entire data table (CTRL+A).

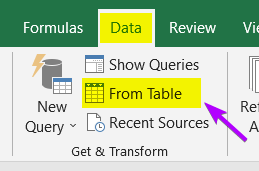
- Click on the Data tab from the ribbon.
- Under the Get & Transform group, hit the From Table option.
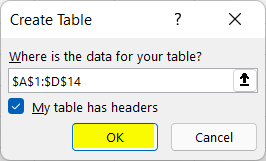
 The Create Table dialog box will come along on the screen. As I have already selected the cell range, so ‘Where is the data for your table?’ box is filled up already.
Remember to tick mark the My data has headers box. - Hit OK.
 The Power Query Editor window will show up.
 - Take the mouse cursor on a column header and select it.
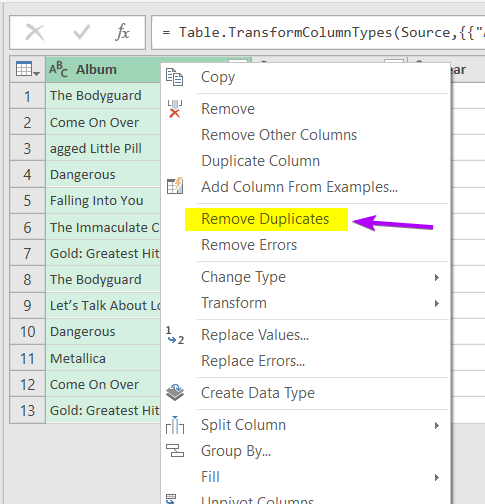
The selected column will turn green color. - Put the cursor on the column header (Album) again and right-click on it.
- Select Remove Duplicates.
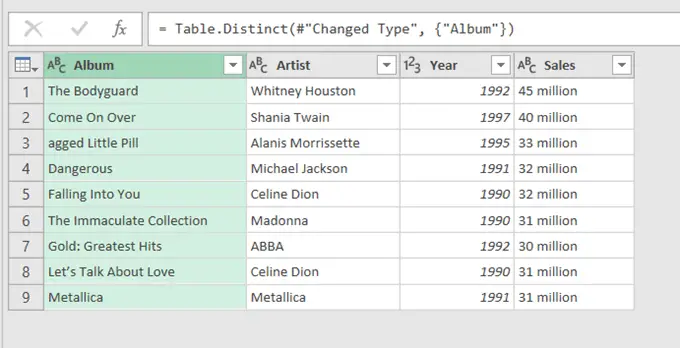
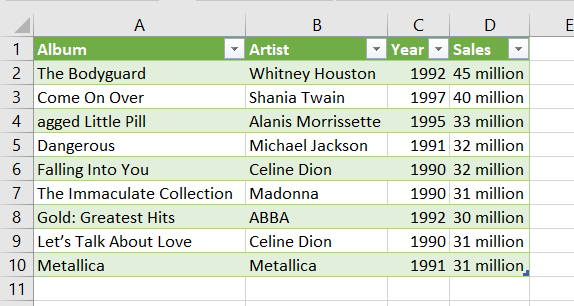
 Now, the identical data are gone from the table.

- Close the Power Query Editor window. Click on Keep in the window.

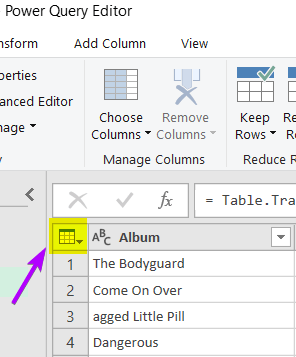
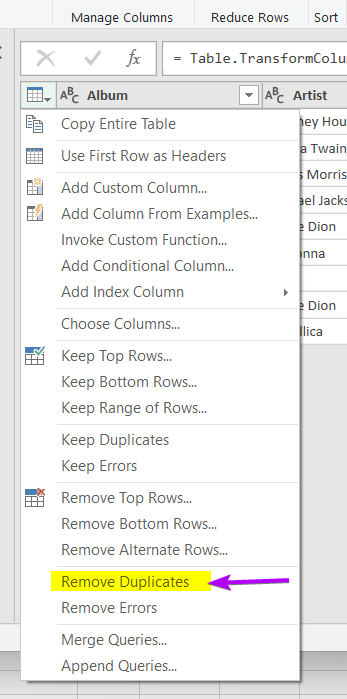
- Click on the small icon on the top-left corner of the table in the Power Query Editor window.

- Select Remove Duplicates.
 If you want to keep only the identical values from the table, you can choose the Keep Duplicates option from the drop-down list.
You will see the resulting table has no similar values now and got a new decorative Cell Style automatically. You can change the cell colors later if you like.
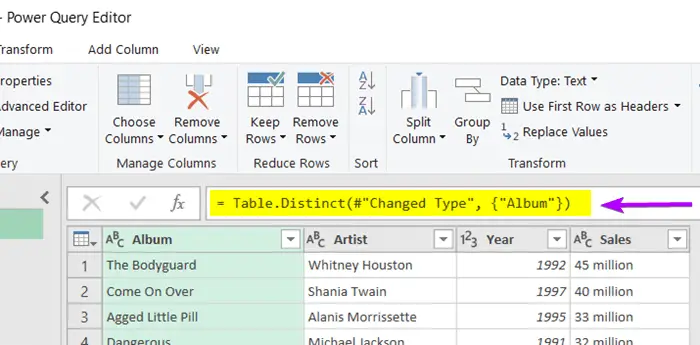
Note: You may have noticed the Table.Distinct function when you entered the Power Query Editor window. So, you can filter out the duplicates by applying the Table.Distinct function straight away. But personally, I prefer the followed steps I showed you above.
Filter Duplicate Values with CONCATENATE & COUNTIFS Functions
You will need two additional columns to use the CONCATENATE function and COUNTIFS functions to extract the unique values from a list.
I am going to put together only two columns in the formula. Two columns are enough to be assured of the similarities of values. But you can compile all the columns in the formula if you wish. In this method, I will be using the CONCATENATE and COUNTIFS functions.
Use CONCATENATE Function to Add Texts in Excel
CONCATENATE function is a tool allowing users to combine multiple pieces of text into a single cell.
Syntax
=CONCATENATE(text1, text2, …)Formula
=CONCATENATE(B2&C2)Formula Breakdown
- B2 is the lookup value which is the top cell of the column Artist.
- C2 is the lookup value which is the top cell of the column Year.
To use the CONCATENATE function to add data of Artist and Year columns, go through these steps below:
- Insert two new columns beside the data table.
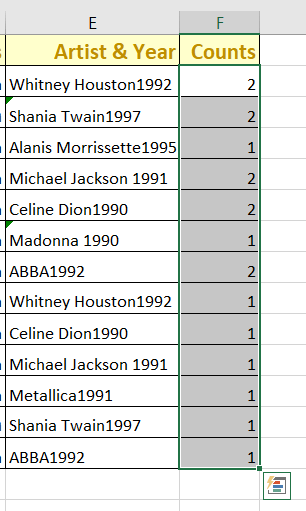
I named the columns Artist & Year and Counts.

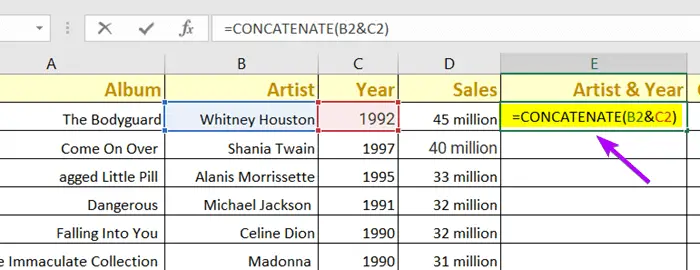
- Then, copy the following formula in the top cell E2: =CONCATENATE(B2&C2)

- Press ENTER.
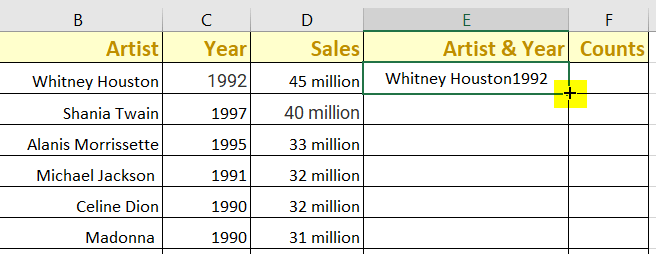
- Now, take the cursor to the bottom-right corner of cell E2. The Fill Handle icon will appear.

- Double-click on the icon to copy the formula up to cell E14.
Apply COUNTIFS Functions to Count Texts in Excel
COUNTIFS provides a powerful solution by enabling users to specify multiple conditions for counting.
Syntax
=COUNTIFS(criteria_range1, criteria1, [criteria_range2, …)Formula
=COUNTIFS(E2:E14,E2)Formula Breakdown
- E2:E14 is the selected range of cells.
- E2 is the criteria cell.
To apply COUNTIFS to count the concatenated text, go through the procedure:
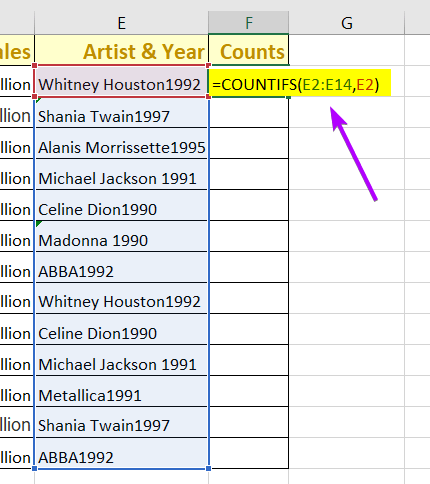
- Select a the top cell (F2) of column F.
- Copy and paste the formula in the selected cell: =COUNTIFS(E2:E14,E2)

- Press ENTER.
- Use the Fill Handle icon to copy the formula up to cell F14.

- Click on the Data tab.
- Under the Sort & Filter group, click on the Filter command.
 A small arrow, Filter drop-down icon, will come along beside all the headers.
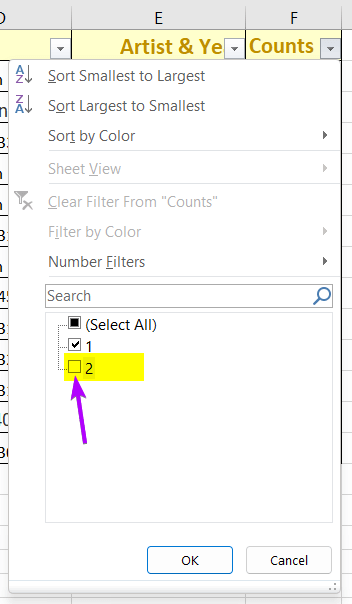
 - Click on the Filter drop-down icon of the Counts header (F1).
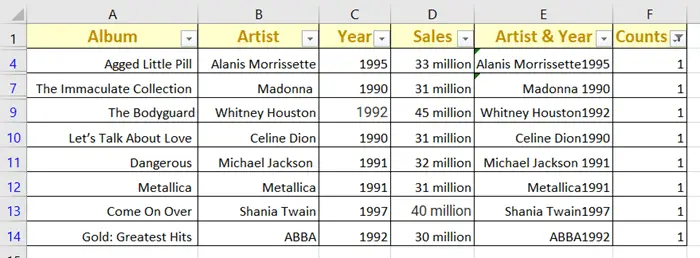
You will see all the checkboxes of values are selected. - Unmark the box of value:2.

- Hit OK.
Removing all the cells having value:2 has erased the duplicate cells. Having a value of 1 means, they are all unique values.
- How to Find Duplicates in Two Columns in Excel (7 Methods)
- Vlookup for Duplicate Values and Return the Matches in Excel [8 Cases]
Conclusion
I have discussed all the easy ways to find duplicate values in Excel. I think now you can smoothly filter out the identical values and remove them. Feel free to share your comments about this article. Also, check our other articles to learn more about Microsoft Excel.
Frequently Asked Questions
What is the filter function in Excel?
In Excel, the FILTER function is a powerful tool that allows users to extract and display data based on specific criteria. It enables dynamic filtering of a range or array, returning only the rows that meet the specified conditions. The FILTER function employs a structured syntax, with parameters for the array or range to filter, as well as the criteria to apply. By using FILTER, users can quickly isolate and analyze data subsets, streamlining data manipulation and enhancing spreadsheet efficiency.
How do I fix duplicate numbers?
To fix duplicate numbers in Excel:
- Select the column or range containing the duplicate numbers.
- Go to the Data tab on the ribbon.
- Click on Remove Duplicates in the Data Tools group.
- In the Remove Duplicates dialog box, uncheck any columns where you want to preserve duplicates.
- Click OK to remove duplicate numbers.
This process automatically identifies and removes duplicate values, leaving you with a cleaned dataset. Adjust options based on your specific needs, and ensure you have a backup or confirm the data meets your requirements after removal.
How do you avoid duplicate values?
To avoid duplicate values in Excel:
- Use Data Validation: Validation by selecting the desired range, navigating to the Data tab, and choosing Data Validation. Opt for Custom from the Allow dropdown and input the formula =COUNTIF($A$1:$A$100, A1)=1
(adjusting the range as necessary) - Conditional Formatting for Duplicates: Employ Conditional Formatting for Duplicates by selecting the range, going to the Home tab, and choosing Conditional Formatting. Opt for Highlight Cells Rules and then Duplicate Values, adjusting formatting preferences and confirming with OK.
- Remove Duplicates: Use the Remove Duplicates feature by selecting the range, heading to the Data tab, and clicking Remove Duplicates. Choose the relevant columns and confirm with OK.
By implementing these steps, you can enforce uniqueness in your data, preventing the entry or identification of duplicate values. Adjust the range and criteria based on your specific needs.
