How to Create a Pivot Table in Excel [A Complete Guide]
- Prepare a dataset in Excel.
- Select the range.
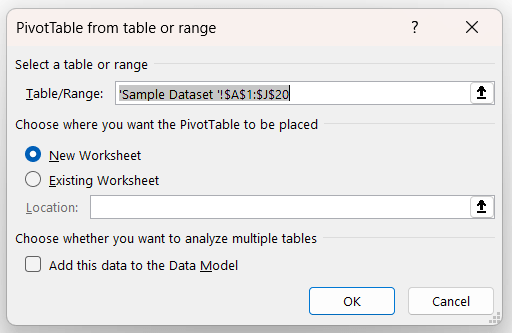
- Go to Insert tab > PivotTable dropdown > From Table/Range option.
- Select a location.
- Click OK.
By following the above steps, you can create a pivot table in Excel. Now, you can work on your pivot table to summarize and analyze data.
What is a Pivot Table?
A pivot table is an Excel tool to summarize and analyze large datasets in Excel. It has several advantageous features. You can do all kinds of calculations like sum, average, maximum, minimum, etc. Pivot tables convert values into percentages.
In addition, they also help to understand patterns and trends. For example, if a company makes its sales summary, it can see the trends of the product. The employees can work on the best-selling item and forecast the upcoming profit and sales.
Sample Dataset to Create a Pivot Table in Excel
To create the pivot table, you have to prepare a dataset first. Here I have prepared a sales report in Excel.
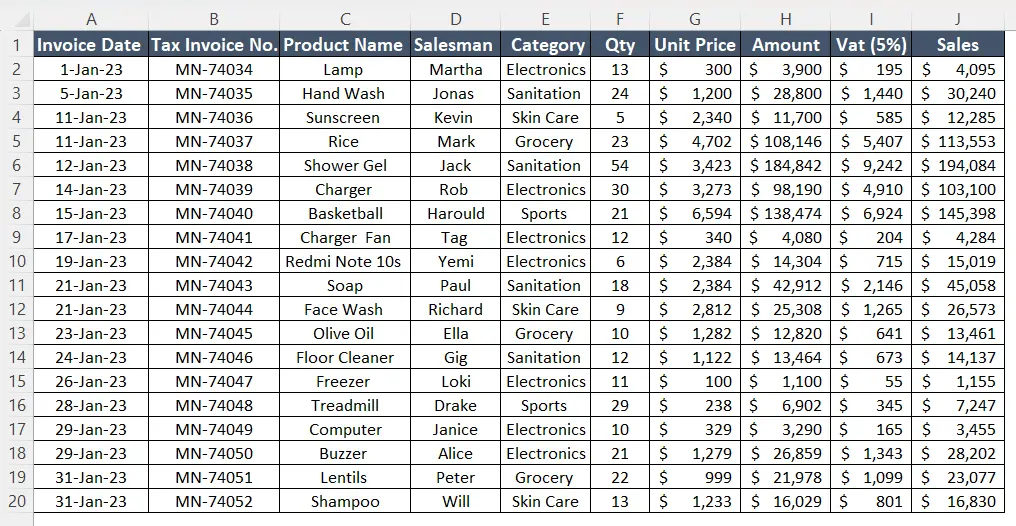
As it is a large dataset, it is difficult to work on it. So, I will insert a pivot table in the later part of this article. Then, I am gonna drag fields, summarize, analyze, sort, and filter data in pivot table fields.
Insert a Pivot Table in Excel
- Select the entire range of data.
- Go to the Insert tab in the ribbon.
- Click on the dropdown of PivotTable.
- Select From Table/Range.
- Choose the location where you want to place the pivot table.
- Click OK.

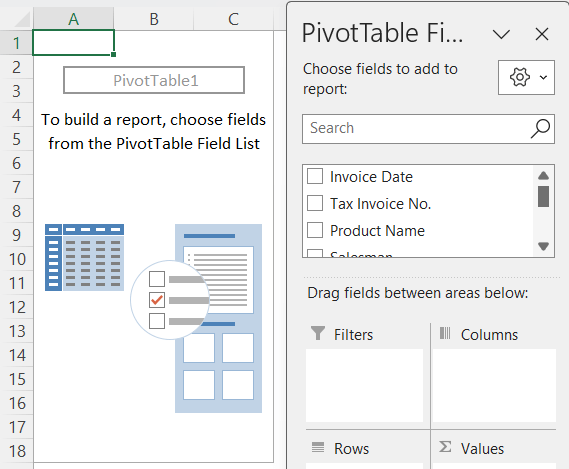
You have created a pivot table. You will see this view in your Excel workbook. Now, you have to select the rows, columns, and filters as per your needs.
Arrange the Pivot Table Fields in Excel
To arrange the pivot table, you have to select the column headers in the following sections, Filters, Columns, Rows, and Values. You can arrange them as per your requirements. You can make the rows into columns, and columns into rows for summarization.
1. Drag PivotTable Fields
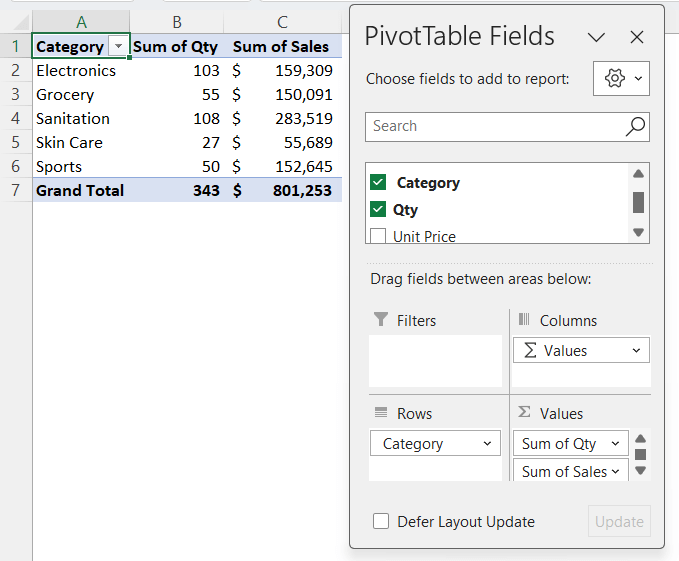
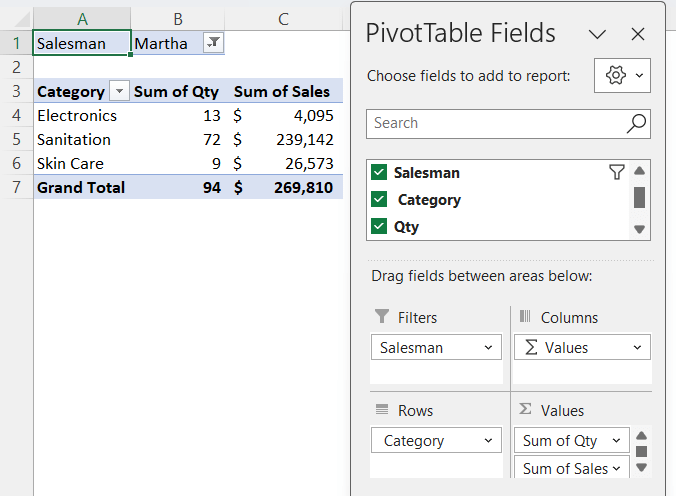
I want to see the sales of each product with quantity. So, I have dragged the category header in the Rows section in PivotTable Fields. To see the quantity of the product and sales values, I have dragged Qty and Sales to the Columns section.
As these two headers are values, there are the sum of quantity and the sum of sales in the Values section under PivotTable Fields.
2. Filter Data
Now, we will learn to filter category-wise sales as per salesman to observe the sales of each salesman. I want to see the sales for a salesman named Martha.
To do that:
- Drag the salesman in the Filters section.
- Click on the Filters icon.
- Click on Martha in the Salesman filter.
3. Sort Data
You can sort the amounts in ascending or descending order to keep an eye on the product details. Now, I will sort the quantity in ascending order. For instance, if any product is almost out of stock, then a company will refill that.
To sort the quantity in ascending order:
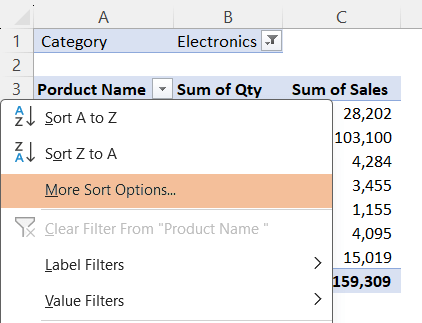
- Click on the dropdown of the first cell of the table.
- Choose More Sort Options from the dropdown list.

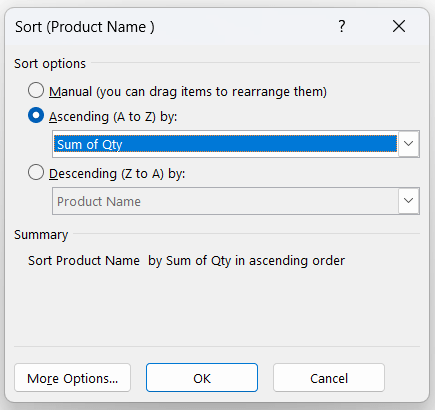
- Select Ascending in the Sort dialog box.
- Choose Sum of Qty from the dropdown.
- Click OK.

Now, you can see the updated result in the pivot table.

Set Value Field Settings
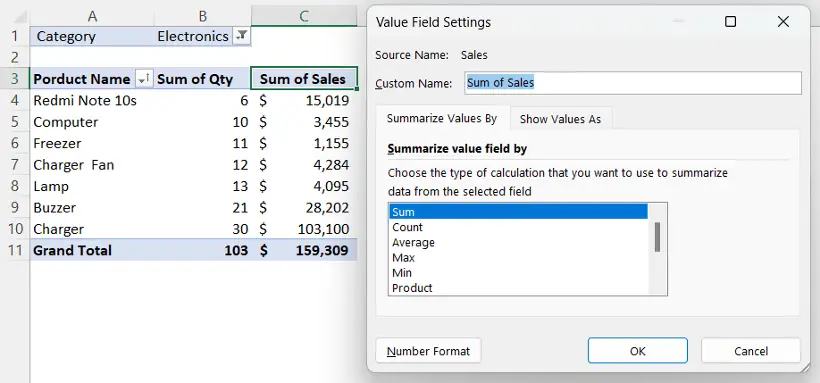
To set the value of any particular column, you can change it from Value Field Settings in Excel. The Sum is selected by default in pivot tables.
To set the value field settings:
- Go to the column header, if you want to change the settings.
- Right-click on it.
- Choose Value Field Settings from the context menu.
- Select the type of calculation you want to summarize from the selected field.

How to Show PivotTable Fields?
After creating a pivot table, you can select a cell in the pivot table to open the pivot table fields. However, sometimes you will not find the pivot table fields even after clicking on the cells inside the pivot table.
To show the PivotTable fields:
- Click on a cell inside the pivot table.
- Go to PivotTable Analyze tab.
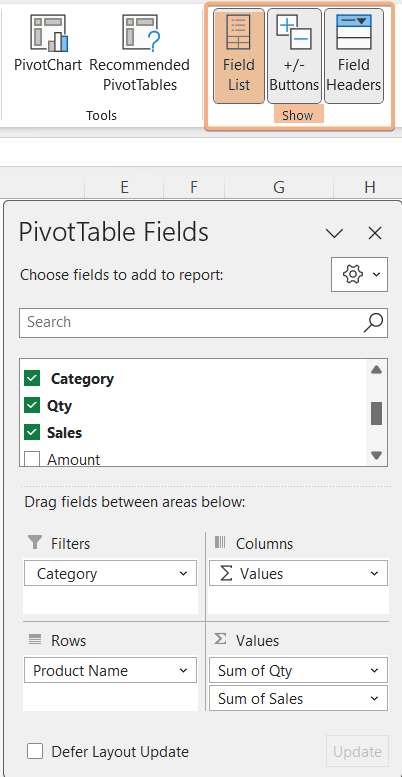
- Navigate to the Show group.
- Select Field List tool.

Refresh Pivot Table in Excel
The pivot table automatically updates if any changes are made. However, you will encounter trouble to update the data.
To refresh a Pivot Table:
- Select a cell inside the pivot table.
- Go to PivotTable Analyze tab.
- Navigate to the Data group.
- Click on Refresh command.
Alternatively, you can use the shortcut keys to refresh the pivot table. Press ALT+F5 to refresh your Pivot Table.

Conclusion
To sum up, this article contains details of creating a pivot table in Excel. Here, I have included the step-by-step guide to each section. Hence, you can follow the steps very easily. You will see the relevant examples to relate to why each segment in the pivot table is important. I hope you won’t face any troubles regarding the pivot table in Excel. You have the guidelines to create it and handle the queries about it.
Frequently Asked Questions
How do I create a simple table from a Pivot Table?
To create a simple table from a Pivot Table in Excel:
- Select the Pivot Table you want to convert.
- Copy the selected data (Ctrl+C).
- Paste it into a new worksheet or location (Ctrl+V).
This process copies the results of your Pivot Table into a regular Excel table, which you can further manipulate or use for different purposes.
How do I create a formula in a PivotTable data?
To create a formula in a PivotTable data:
- Click on the Pivot Table.
- Navigate to the PivotTable Analyze tab.
- Go to Calculations group > Fields, Items, & Sets dropdown, and select Calculated Field option.
- In the Name box, provide a name for the field you’re creating.
- In the Formula box, input the desired formula using Excel functions.
- Click Add to generate the calculated field in the PivotTable and hit OK.
