How to Calculate the Beta of a Stock in Excel [Step-by-Step]
What is the Beta of a Stock?
Beta is a measure of a stock’s sensitivity to market movements. It helps investors assess the risk associated with a particular stock compared to the overall market. A beta value of 1 indicates that the stock’s price is expected to move in line with the market, while a beta greater than 1 suggests higher volatility, and a beta less than 1 indicates lower volatility.
Why is Beta Important?
Understanding a stock’s beta is vital for investors as it provides insights into the stock’s risk profile. A high-beta stock may offer higher potential returns but comes with increased volatility and risk. Conversely, a low-beta stock tends to be less volatile but may provide lower returns. By incorporating beta into your investment analysis, you can tailor your portfolio to match your risk tolerance and investment goals.
Steps to Calculate the Beta of a Stock in Excel
Embarking on the journey to calculate the Beta of a stock in Excel involves a systematic process that combines financial data and Excel functions. Follow these steps to unravel the Beta mystery and gain insights into a stock’s risk exposure.
Now follow these steps to calculate the beta of a stock in Excel:
Step 1: Gather Historical Data
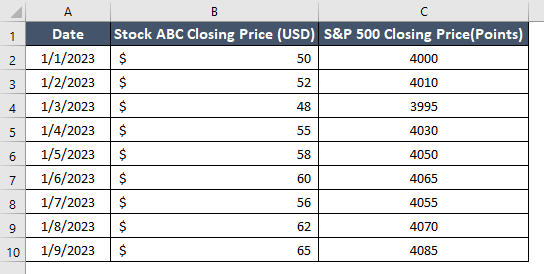
To prepare a dataset for calculating the beta of a stock in Excel, you’ll need historical stock prices for the specific stock and a market index. Let’s assume you’re analyzing the beta of Stock ABC to the S&P 500 index. Below is a sample dataset:
Step 2: Calculate Daily Returns
From this dataset, I will calculate the daily returns in Excel. Now follow these steps to do that:
- Insert two columns to store daily returns for stock ABC and S&P 500 closing price.
- In cells D2 & E2, enter the value 0 manually.
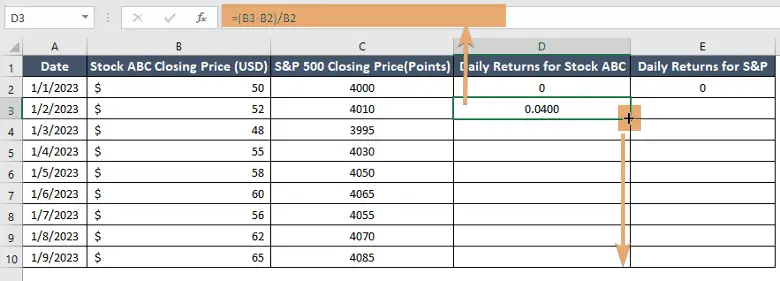
- In cell D3, enter the formula to calculate daily returns for Stock ABC: =(B3-B2)/B2
- Drag this formula down for the rest of the Stock ABC closing prices.

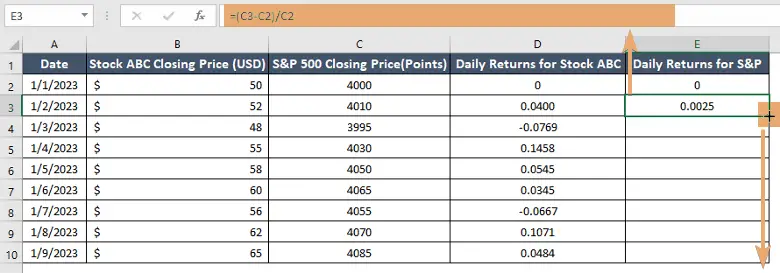
- In cell E3, enter the formula to calculate daily returns for the S&P 500: =(C3-C2)/C2
- Drag this formula down for the rest of the S&P 500 closing prices.

Now, columns D and E contain the calculated daily returns for Stock ABC and the S&P 500, respectively.

These columns now show the daily returns for Stock ABC and the S&P 500, calculated based on the provided closing prices. You can use these returns for the subsequent steps in calculating beta.
Step 3: Find Covariance
To calculate the covariance between the daily returns of Stock ABC and the S&P 500 in Excel, follow these steps using the provided dataset. Assuming that your daily returns for Stock ABC are in column D, and the daily returns for the S&P 500 are in column E, you can calculate the covariance as follows:
- Click on an empty cell.
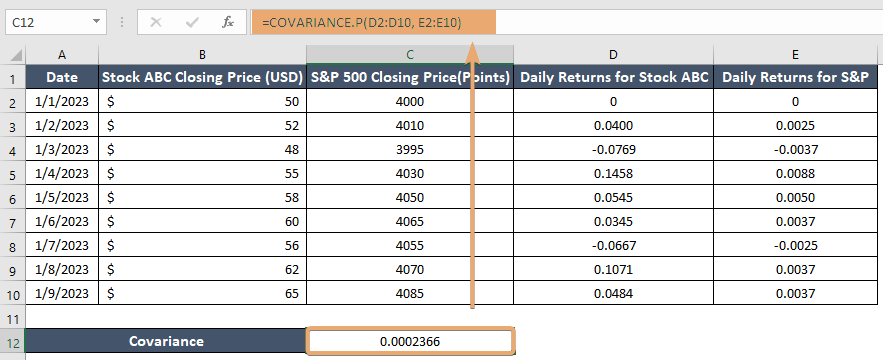
- Enter the following formula to calculate the covariance: =COVARIANCE.P(D2:D10, E2:E10)
- Press ENTER.
This formula uses the COVARIANCE.P function to calculate the covariance between the daily returns of Stock ABC and the S&P 500. The selected cell should display the covariance between the daily returns of Stock ABC and the S&P 500.
Step 4: Calculate Market Variance
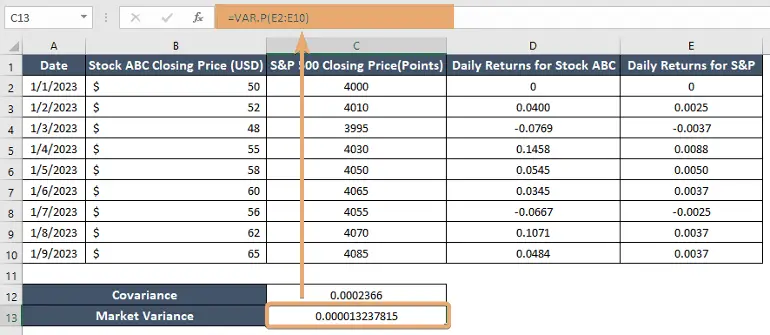
To calculate the variance of the market (S&P 500 daily returns) in Excel, follow these steps using the provided dataset. Assuming that your daily returns for the S&P 500 are in column E, you can calculate the variance as follows:
- Select an empty cell.
- Enter the following formula to calculate the variance: =VAR.P(E2:E10)
- Press ENTER.
This formula uses the VAR.P function to calculate the variance of the daily returns of the S&P 500. Now, the selected cell should display the variance of the market (S&P 500) daily returns.
Step 5: Determine Beta
To determine the beta of a stock in Excel, you’ll use the covariance and variance values calculated earlier. The formula for beta is:
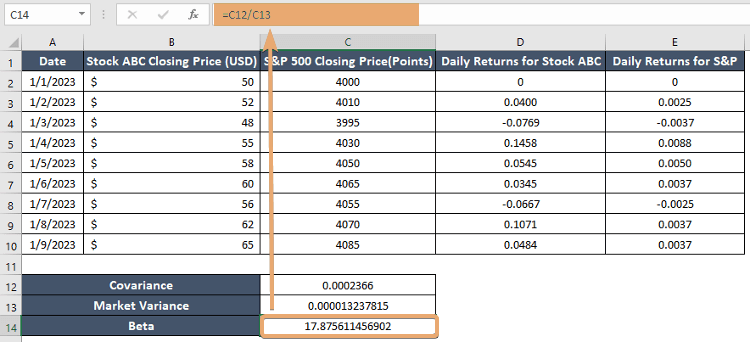
Beta = Covariance of Stock and Market/ Market VarianceIn this data, the covariance is in cell C12, and the market variance is in cell C13. You can determine the beta by entering the following formula:
- Navigate to an empty cell.
- Enter the formula for beta: =C12/C13
- Press ENTER.
Now, the selected cell should display the beta of Stock ABC in relation to the S&P 500.
The beta value indicates the stock’s sensitivity to market movements. A beta of 1 means the stock moves in line with the market. If beta is greater than 1, the stock is more volatile than the market, and if it’s less than 1, the stock is less volatile.
Conclusion
Mastering the art of calculating beta in Excel is a valuable skill for any investor seeking to make informed decisions in the stock market. By following these steps, you can assess a stock’s risk relative to the broader market, allowing you to build a well-balanced and resilient investment portfolio. Remember, knowledge is the key to success in the dynamic world of finance, and calculating beta is a powerful tool in your investor toolkit.
Frequently Asked Questions
What is the slope of the beta in Excel?
In Excel, calculating the slope of the beta involves using the SLOPE function. The beta, in the context of finance, is a measure of a stock’s volatility in the market. To calculate the slope of the beta, follow these steps:
- Organize your data: Create two columns, one for the stock’s returns and another for the market returns, over a specific period.
- In an empty cell, type the following formula: =SLOPE(StockReturns, MarketReturns)
Replace StockReturns with the range of cells containing your stock returns and MarketReturns with the range for market returns. - Press ENTER.
The result will be the slope of the beta, representing the stock’s sensitivity to market movements. Remember, this calculation assumes that your data is organized chronologically, and you have a corresponding pair of stock and market returns for each period.
How to calculate regression in Excel?
To calculate regression in Excel, follow these steps:
- Organize Data: Arrange your independent variable (X) and dependent variable (Y) data columns.
- Insert Scatter Plot: Select your data and go to the Insert tab. Choose Scatter and then Scatter with Straight Lines.
- Add Trendline: Right-click on a data point, select Add Trendline, and choose the linear regression option.
- Display Equation: Check the Display Equation on Chart box to show the regression formula on the chart.
- Get Coefficients: The equation will be in the form of Y = mx + b. The coefficient ‘m’ is the slope, and ‘b’ is the intercept.
