How to Calculate Portfolio Return in Excel [Step-by-Step]
In the dynamic world of finance, understanding the performance of your investment portfolio is crucial for making informed decisions. Calculating portfolio returns is an essential skill for investors seeking to gauge the success of their investment strategies. In this guide, I will walk you through the process of calculating portfolio returns using Excel, providing you with a powerful tool to assess your investments and make data-driven decisions.
What is Portfolio Return?
Portfolio return refers to the financial gain or loss generated by an investment portfolio over a specific period. It is a measure that assesses the performance of a collection of financial assets, such as stocks, bonds, and other securities, collectively held by an investor. Portfolio return is a crucial metric for investors and financial analysts as it provides insights into the overall profitability of an investment strategy.
Portfolio Return Formula
The formula for calculating the portfolio return is relatively straightforward. Portfolio return is typically expressed as a percentage. The formula is as follows:
Portfolio Return =((Current Portfolio Value − Initial Portfolio Value)/Initial Portfolio Value)×100Here’s a breakdown of the elements in the formula:
- Current Portfolio Value: This represents the total market value of the portfolio at the end of the specified period.
- Initial Portfolio Value: This is the total market value of the portfolio at the beginning of the same period.
- The numerator (Current Portfolio Value−Initial Portfolio Value) calculates the change in the portfolio’s value over the period.
- The entire fraction calculates the relative change as a proportion of the initial value. (Current Portfolio Value−Initial Portfolio Value)/Initial Portfolio Value)
- Multiplying by 100 converts the result to a percentage, making it more interpretable.
In summary, the portfolio return formula quantifies the percentage change in the value of a portfolio over a specified period, considering both capital gains and income generated by the underlying assets.
Steps to Calculate Portfolio Return in Excel
Calculating the portfolio return in Excel is a fundamental step for investors to assess the performance of their investment portfolios. By following a systematic approach, you can analyze daily returns, determine average daily returns, and ultimately calculate the annualized return. Visualizing this data through charts provides valuable insights for making informed investment decisions.
Now, follow these steps to calculate portfolio return in Excel:
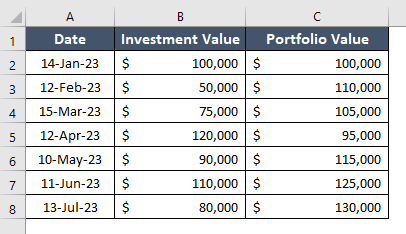
Step 1: Prepare the Dataset in Excel
To prepare a dataset to calculate portfolio return in Excel, go through these steps below:
- Begin by entering your investment data. In Column A, record the dates of your transactions or periods. Simultaneously, in Column B, detail the amount invested for each date.
- In Column C, record the current value of your portfolio for each corresponding date. This value can be based on the market prices of your investments.

Step 2: Calculate Daily Returns
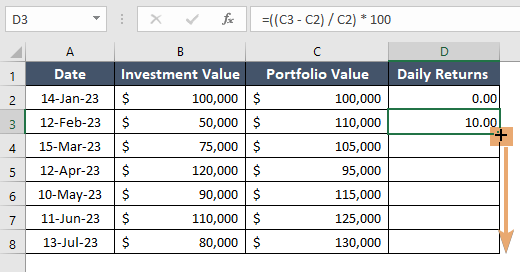
To assess daily performance, you’ll need to calculate daily returns. Use the formula below:
Daily Return = (Portfolio Valuecurrent day−Portfolio Valueprevious day)/Portfolio Valuepreviousday ×100- Insert a column to store daily returns.
- In cell D2, input “0” as there is no Portfolio Valuepreviousday for the first data.
- In Excel, input the formula as follows: =((C3 – C2) / C2) * 100
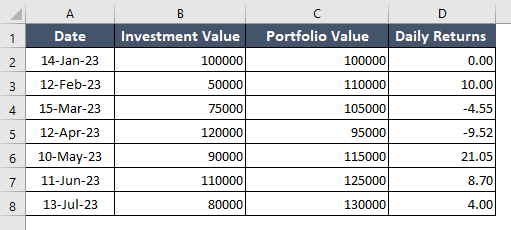
- Drag this formula down for all rows in the “Daily Return” column.

By following these steps, you will see the stored daily return value in column D, where I inputted 0 manually in the first cell.
Step 3: Find the Average Daily Return
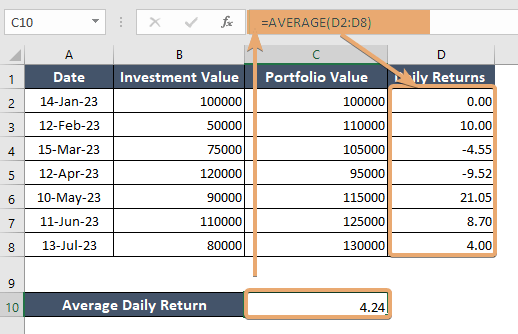
To find the average daily return, use the formula:
Average Daily Return =AVERAGE(Daily Return range)- In this step, first, select a cell to store the average daily return in Excel. Then, copy this formula: =AVERAGE(D2:D8)
- Next, press ENTER.
Step 4: Calculate Annualized Returns
Annualized returns provide a standardized measure that enables investors to compare the performance of different portfolios or strategies.
Syntax
Annualized Return=((1+Average Daily Return)^252−1)×100Here are the steps to follow to calculate annualized returns in Excel:
- Select a blank cell (let’s assume, it’s in cell C11).
- Type this formula: =(((1 + C10)^252) – 1)*100
The entire formula is used to calculate the annualized return. The value in cell C10 is assumed to represent the average daily return. The formula raises this average daily return to the power of 252 (or the number of trading days in a year), subtracts 1 to get the compounded return, and then multiplies by 100 to express it as a percentage.
- Press ENTER.
Now, cell C11 should display the annualized return based on the average daily return in your dataset.
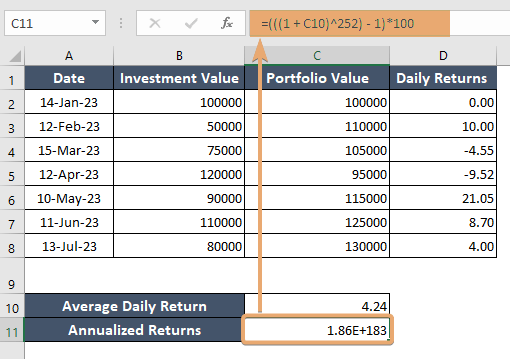
The annualized return gives you a standardized measure of your portfolio’s performance over a year, accounting for compounding effects.
Step 5: Visualize Portfolio Performance
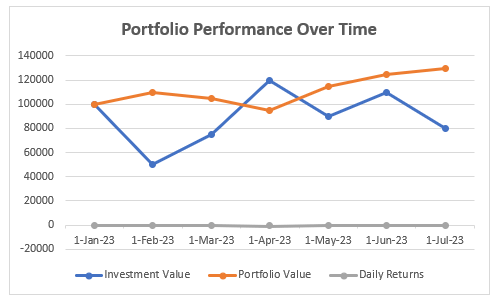
Visualizing portfolio performance is crucial for gaining insights and making informed investment decisions. Creating charts in Excel is an effective way to represent portfolio data graphically. Below are instructions on how to visualize portfolio performance using a line chart in Excel:
- Highlight the data you want to visualize, including dates, portfolio values, or other relevant columns.
- Go to the Insert tab in Excel.
- Click on Line in the Charts section.
- Once the chart is inserted, right-click on different chart elements to customize:
Axis Labels: Right-click on the axis labels to format and adjust them.
Data Labels: Add data labels to display specific values on the chart. - Click on the chart title to change it to something descriptive, like “Portfolio Performance Over Time”.
A line chart will visually represent the trend in your portfolio values over time. Use it to identify patterns, fluctuations, or periods of significant growth or decline. Annotations or data labels can help highlight specific points on the chart, such as dates with the highest or lowest returns.
Additional Tips
- Consider adding a secondary axis for Daily Returns if you want to overlay that information on the same chart.
- Experiment with different chart types (e.g., area chart, stacked area chart) to visualize data in various ways.
Conclusion
Congratulations! By following this step-by-step guide, you’ve embarked on a journey to unravel the mysteries of your portfolio’s performance using Excel. Armed with calculated returns and visual insights, you are now better equipped to make informed investment decisions, steering your financial ship toward success. Dive into the world of Excel-powered portfolio analysis, and let the numbers guide you to greater financial heights
Frequently Asked Questions
How do I calculate return on investment percentage in Excel?
To calculate the return on investment (ROI) percentage in Excel, use the formula:
ROI %=(Net ProfitInvestment Cost)×100This formula helps determine the percentage gain or loss on an investment relative to its cost.
What is a good return on stock portfolio?
A good return on a stock portfolio is subjective and depends on various factors, including individual financial goals, risk tolerance, and market conditions. However, historically, an annual return of 7-10% is often considered a solid long-term average for a diversified stock portfolio. Investors should tailor their expectations based on their specific circumstances and investment strategy.
