How to Calculate Revenue Growth Rate in Excel [2 Ways]
What is Revenue?
Revenue is the total income generated by a company through its primary operations, such as selling goods or providing services. It is a critical financial metric that reflects the company’s sales or turnover over a specific period. Revenue can also be referred to as sales, sales revenue, or turnover.
In the easiest language, revenue is the total income of a company in a given period of time. The income can come from either selling goods or selling services.
Formulas to Calculate the Revenue
Two formulas to calculate revenue are:
- Revenue = Average Price of Units * Total Units Sold
This formula calculates revenue by multiplying the average price of the products or services by the total number of units sold. It’s commonly used when a company sells products or services in bulk quantities.
- Revenue = Average Price * Total Number of Customers
This formula determines revenue by multiplying the average price of products or services by the total number of customers. It’s useful when a business charges customers individually for products or services. These formulas are fundamental for assessing a company’s income.

What is the Revenue Growth Rate?
Revenue Growth Rate is a metric that measures the rate at which a company’s revenue is increasing or decreasing over time. It is usually expressed as a percentage and helps assess the company’s performance and financial health.
A positive revenue growth rate indicates that the company’s sales are increasing, which is generally a positive sign. On the other hand, a negative growth rate suggests a decline in sales.
Revenue growth is an essential indicator for investors and stakeholders to evaluate a company’s financial performance and its potential for future success.
Formulas to Calculate the Revenue Growth Rate
The formula to calculate the Revenue Growth Rate is:
Revenue Growth Rate = (Ending Value – Starting Value) / Starting Value
Or, Revenue Growth Rate = (Ending Value / Starting Value) – 1
These formulas help determine the percentage change in revenue over a specific time period. They are valuable tools for evaluating a company’s financial performance and growth trends.

The revenue growth rate can be calculated weekly, month to month, and year to year.
Calculate Revenue Growth Rate in Excel Using Formula: Revenue Growth Rate=(Ending Value / Starting Value)-1
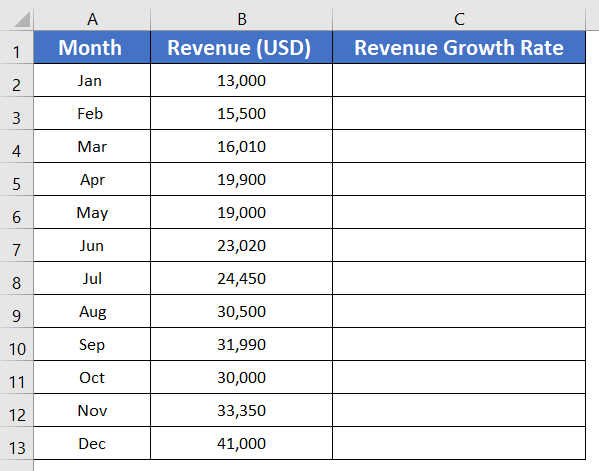
The dataset I am using for this article has three columns:
- Month ( Column A)
- Revenue (USD) ( Column B)
- Revenue Growth Rate ( Column C)
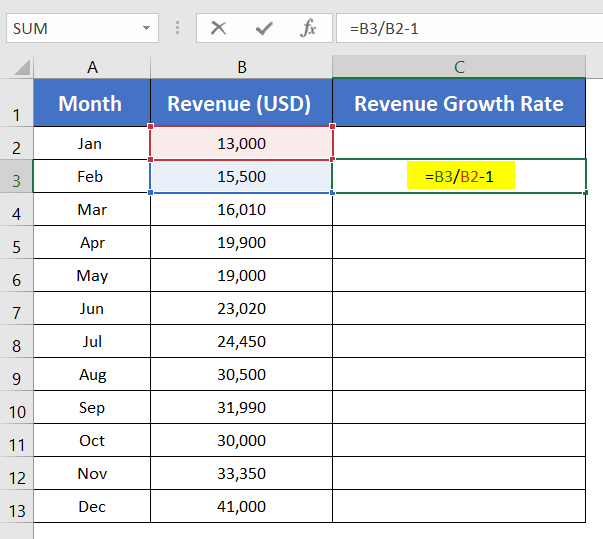
Here, you can use the formula below to calculate the revenue growth rate:
=B3/B2-1
Here,
- B2 is the Starting Value.
- B3 is the Ending Value.
- I applied the formula in cell C3 because B2 is the first Starting Value and B3 is the first Ending Value. Before B2, there is no beginning value. So you can’t show any change of values in cell C2.
In this article, I am going to display the monthly change in revenue. However, you can also use this method to compute the weekly change or the yearly change.
Steps to Calculate Revenue Growth Rate in Excel:
- Add a new column to your Excel sheet where you want to display the revenue growth rate.
You can name this column for clarity, such as “Revenue Growth Rate.” - In this new column (e.g., cell C3), click to select the cell where you want to calculate the growth rate.
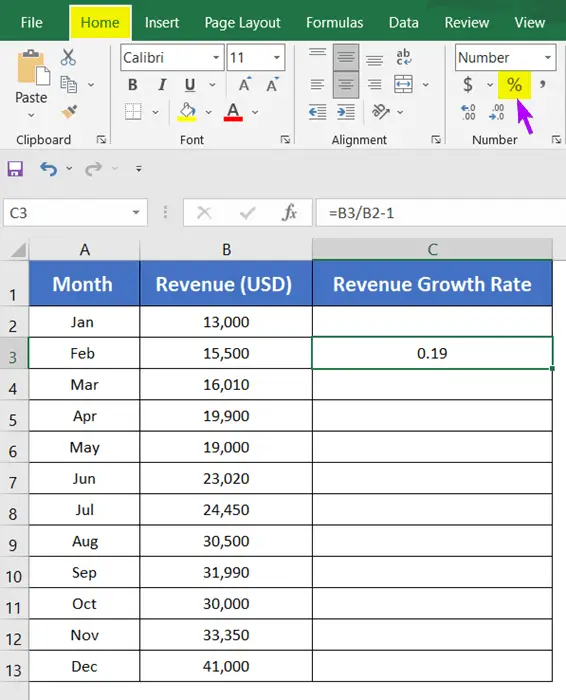
- In the selected cell (C3), input the formula: =B3/B2-1
- After typing the formula, press the ENTER key.
The result will be displayed as a decimal, representing the revenue growth rate. This formula helps analyze how revenue has changed over a specific period in Excel.
Change Revenue Growth Rate from Decimal to Percentage in Excel
- Select cell C3.
- Select the Home tab.
- Click on the ‘%’ icon from the Number group.

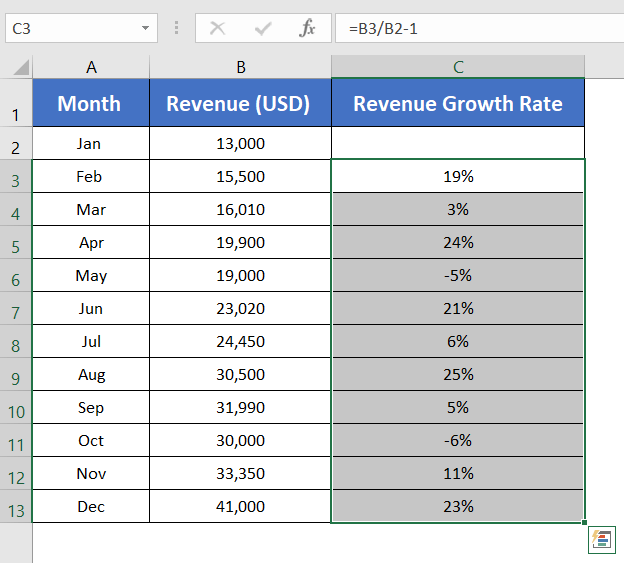
- Double-click on the Fill Handle to fill down the formula from cell C3 to C13.
Here is the outcome. Take a look.
Calculate Revenue Growth Rate in Excel Using Formula: Revenue Growth Rate=(Ending Value-Starting Value)/Starting Value
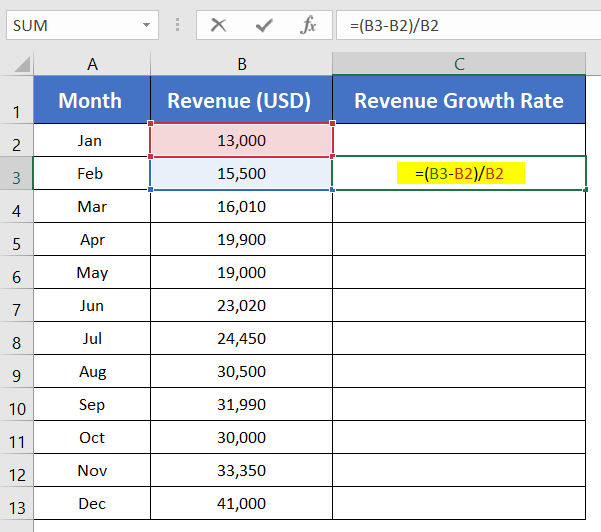
Basically, the formula is to find the difference between your initial and final revenue, and then divide that difference by your initial revenue. I’m going to use that formula to figure out your revenue growth rate, and then I’m going to add the percentages associated with that in the following steps.
Follow these steps to calculate the Revenue Growth Rate in Excel with an alternate formula:
- Add a new column (e.g., column C) where you’ll display the results.
- Choose a cell within the new column (e.g., C3).
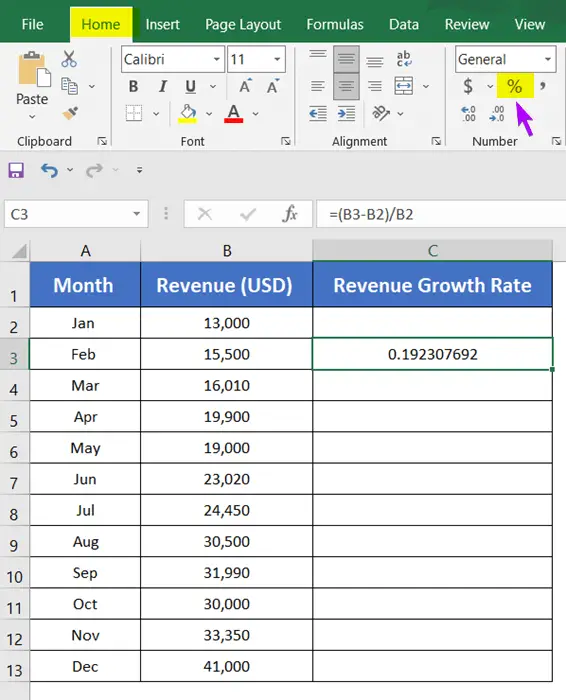
- In the selected cell (C3), input this formula: =(B3-B2)/B2
- After typing the formula, press ENTER.
The result will be in decimal form, like 0.192307692. While you can keep it as is, it’s common to express growth rates in percentages for clarity.
Applying Percentage to Revenue Growth Rate in Excel
- Click once on the cell (C3) containing the decimal revenue growth rate that you want to convert to a percentage.
- Navigate to the Home tab in Excel.
- In the Number group, click on the ‘%’ icon. This action transforms the content of the selected cell into a percentage.

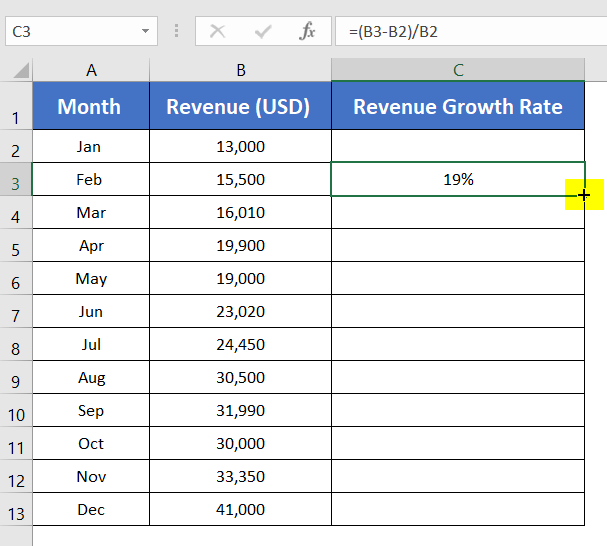
- Double-click on the Fill Handle located in the lower-right corner of cell C3 to auto-fill the formula to the desired range.

The final result will display the revenue growth rate as a percentage, making it easier to interpret and work with.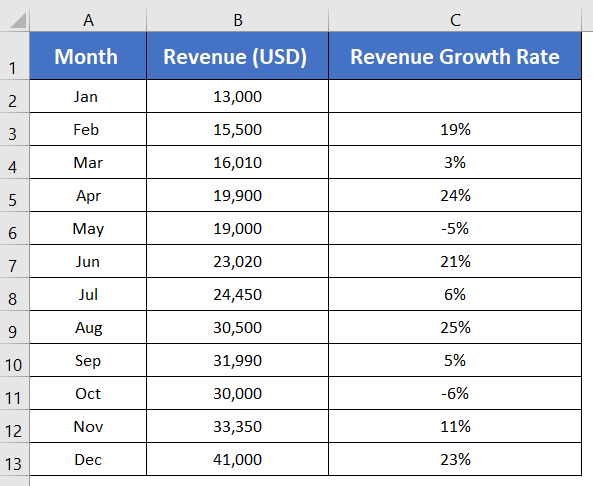
Conclusion
I hope that this article has provided you with all the information you need to know about revenue growth rate. If you have any questions about this blog, please do not hesitate to comment below.
Frequently Asked Questions
What is total revenue growth?
Total revenue growth refers to the increase in a company’s overall revenue over a specified period, often measured as a percentage. It reflects the company’s ability to generate more income from its core business activities. Total revenue growth considers all revenue sources, including sales of products or services, investments, and other income streams. This metric is crucial for assessing a company’s financial health and performance, indicating whether it is expanding, contracting, or maintaining its revenue levels. It’s a key indicator for investors, analysts, and stakeholders to evaluate a company’s overall financial trajectory.
What is 5-year revenue growth?
5-year revenue growth is the measure of how much a company’s total revenue has increased over a period of five years. It indicates the company’s ability to expand its revenue and is a significant financial metric for assessing long-term performance. A positive 5-year revenue growth signifies a company’s sustained financial health and growth over an extended period, while negative growth may suggest challenges or declining performance.
What are the two types of revenue growth?
Revenue growth strategies are typically divided into two broad areas. They are:
- Organic Revenue Growth: This type of growth is achieved through increasing sales from existing products or services to existing customers or by expanding the customer base through marketing and sales efforts. It does not involve mergers or acquisitions.
- Inorganic Revenue Growth: This growth is achieved through activities like mergers, acquisitions, or partnerships. It involves adding new products, services, or customer segments through external means rather than internal sales efforts.
Understanding these two types of revenue growth helps businesses strategize and plan for sustainable financial success.
What is a good growth rate for revenue?
A good growth rate for revenue can vary widely depending on factors such as the industry, business size, and economic conditions. In general, a sustainable and healthy revenue growth rate is typically in the range of 5% to 20% per year. However, what constitutes a “good” growth rate will depend on the specific circumstances and goals of a business. Smaller, more established companies might aim for steady, moderate growth, while startups and high-growth industries may target much higher rates. It’s essential to consider the industry benchmarks, market dynamics, and the company’s own objectives when evaluating revenue growth.
What is the KPI for revenue growth?
Key Performance Indicators (KPIs) for revenue growth are metrics used to assess and measure a company’s performance in increasing its revenue over time. Some important KPIs for revenue growth include:
- Year-Over-Year Growth: Measures the increase in revenue from one year to the next, often expressed as a percentage.
- Compound Annual Growth Rate (CAGR): Provides the annual growth rate of revenue over a specific period, which accounts for compounding.
- Customer Acquisition Cost (CAC): Evaluates the cost of acquiring new customers in relation to the revenue generated from those customers.
- Customer Lifetime Value (CLV): Assesses the total revenue a company can expect to generate from a customer throughout their relationship with the company.
- Churn Rate: Measures the rate at which customers stop doing business with the company, which can impact revenue growth.
These KPIs help businesses track and optimize their revenue growth strategies and performance.
How do you calculate revenue growth year-over-year in Excel?
Steps to calculate Year-Over-Year (YoY) Revenue Growth in Excel:
- Ensure your revenue data is in columns with one for years and another for revenue.
- Add a column next to revenue for the growth calculations.
- In the new column, use the formula =(B2 – B1) / B1 for year-over-year growth.
- Copy the formula down to calculate growth for subsequent years.
- Change the number format to a percentage if you prefer.
This formula subtracts the revenue for the current year (B2) from the revenue for the previous year (B1) and then divides the result by the revenue for the previous year to calculate the growth rate.
Related Articles
- How to Calculate Annual Growth Rate in Excel (5 Different Cases)
- Calculate Dividend Growth Rate in Excel [2+ Formulas]
- 2 Ways to Calculate Bacterial Growth Rate in Excel
- 3 Ways to Forecast Growth Rate in Excel
- 3 Scenarios of Exponential Growth Formula in Excel
- 2+ Ways to Calculate Monthly Growth Rate in Excel
