4+ Ways to Find Duplicates in a Column and Delete Rows in Excel
Duplicate data can be a real pain. It often sneaks up on you when you have to merge two or…
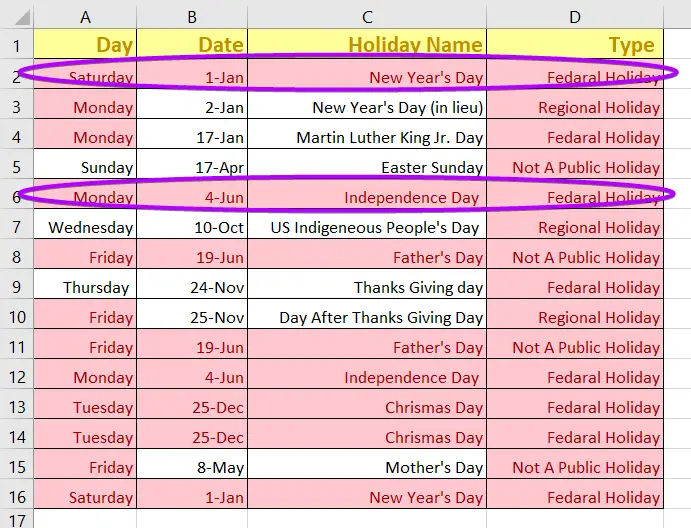
Duplicate data can be a real pain. It often sneaks up on you when you have to merge two or…
If you are a frequent user of Microsoft Excel, you are undoubtedly already familiar with the terms “cell” and “sheet“….
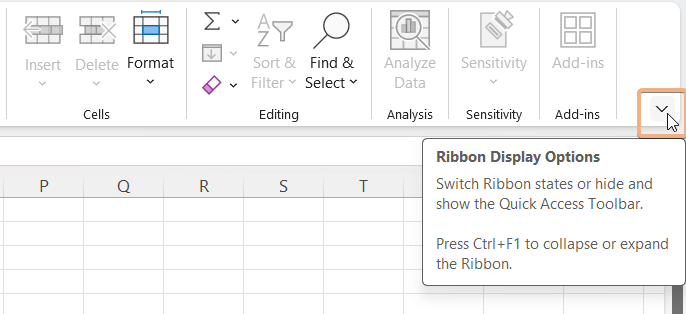
The easiest way to display the ribbon in Microsoft Excel is to use the keyboard shortcut CTRL+F1. What is the…
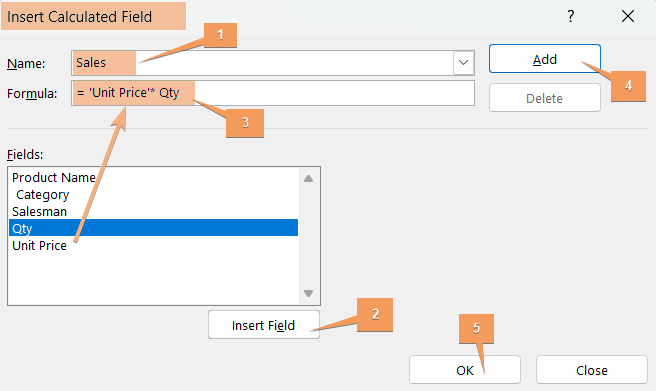
By following the quick steps below, you will able to add calculated fields to an Excel Pivot Table, based on…
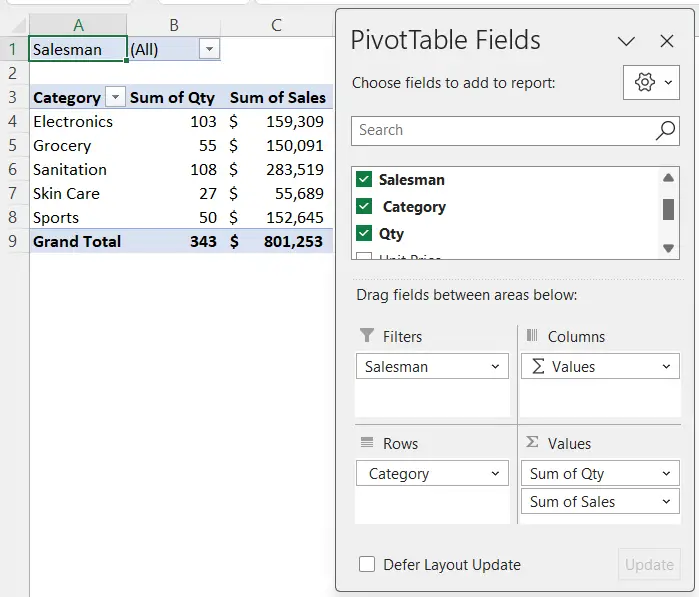
A pivot table (or PivotTable, as Microsoft calls them) is a dynamic and interactive tool in Microsoft Excel that allows…
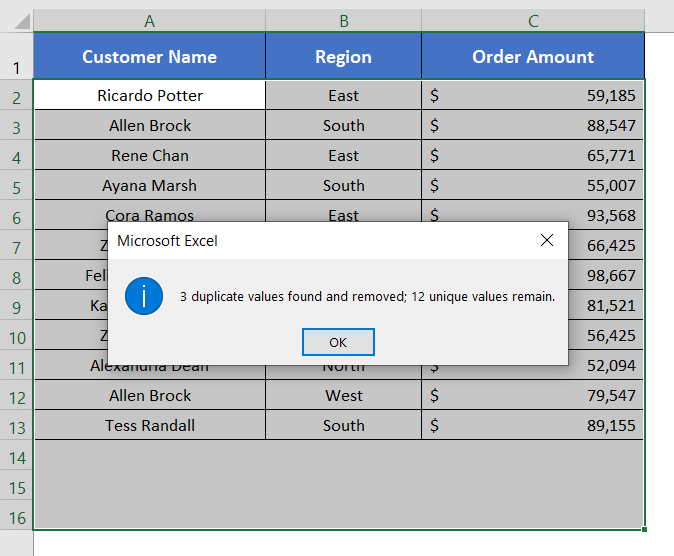
One of the most obvious tasks as part of the data cleaning process is to remove duplicates. Well, there are…
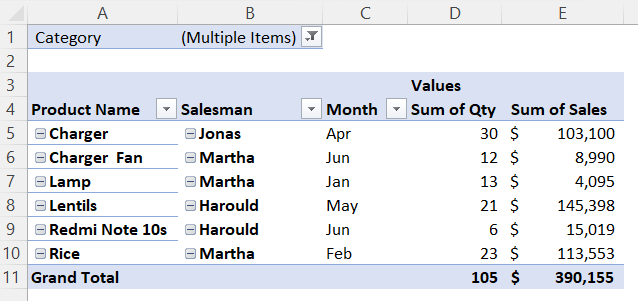
When you add multiple fields to the Rows area in a Pivot Table in Excel, by default, all the fields…
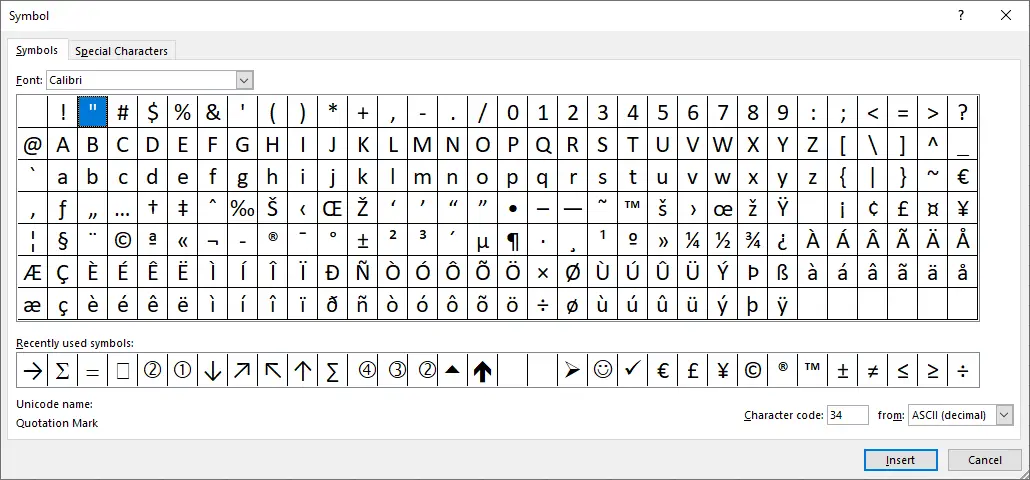
The CHAR function returns a character specified by the code number from the character set for your computer. For example,…
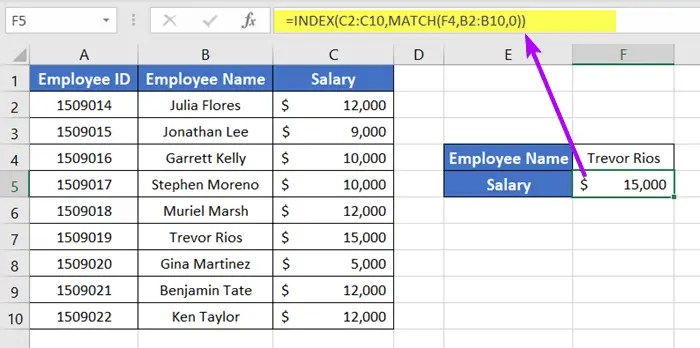
Generally, we use the VLOOKUP function to look up a certain value vertically across columns. One of the major conditions…
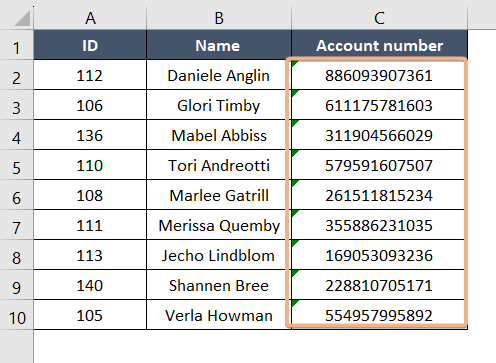
One of the most widely used programs for processing, modifying, and presenting data is Microsoft Excel. Excel, however, is not…