How to Ungroup Date in Pivot Table in Excel [2 Methods]
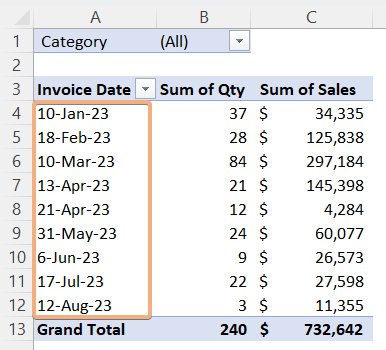
This Pivot Table contains a short sales report. Sales values are shown along with the number of products. The data is sorted by date, and I have divided the data into months and quarters. Now, let’s ungroup the data in the Pivot Table in Excel.

Ungroup Date Using Context Menu in Pivot Table in Excel
- Select a cell in the Pivot Table containing the grouped date.
- Right-click on the cell.
- Choose Ungroup option from the Context Menu.
This action will ungroup all the date values within the Pivot Table in Excel.

Ungroup Date by Excel Ribbon in Pivot Table in Excel
- Select any cell from the grouped date within the Pivot Table.
- Go to PivotTable Analyze tab.
- Click Ungroup in the Excel Ribbon.

By clicking on this option, you can ungroup the grouped dates within the Pivot Table in Excel.

Conclusion
In conclusion, ungrouping dates in an Excel Pivot Table is a breeze. This quick process unravels aggregated date entries, offering a clearer, more detailed perspective on your data. By making ungrouping simple and efficient, Excel empowers users to dive deeper into their data analysis with ease. In this article, I have added 2 ways to ungroup dates within a Pivot Table. Just go through the procedure and apply it to your Pivot Table.
Frequently Asked Questions
How do I fix the date format in a Pivot Table?
To fix the date format in a Pivot Table, follow these steps:
- Select the column with date values in your Pivot Table.
- Right-click and choose Format Cells.
- In the Format Cells dialog box, go to the Number tab.
- Select the desired date format from the list.
- Click OK to apply the changes.
Following these steps ensures your Pivot Table displays dates in the format you need for effective data analysis.
Why is my Pivot Table grouping dates into months?
When your Pivot Table automatically groups date into months, it’s Excel’s way of organizing and summarizing date data for easier analysis. This feature helps in aggregating information, providing a clearer overview of trends and patterns over time. If you want to prevent automatic grouping, ensure your date field is formatted as a date in the source data, and when creating the Pivot Table, make sure the “Add to Data Model” option is unchecked. This allows you more control over how dates are presented in your Pivot Table.
How do you group dates by month in Pivot Table?
To group dates by month in a Pivot Table, follow these steps:
- In your Pivot Table, select the column that contains the date values.
- Right-click on any of the date values in the selected column.
- Choose the Group option from the context menu.
- In the Grouping dialog box, select Months and unselect other options if needed.
- Click OK.
This will group the date values by month in your Pivot Table, providing a summarized view of data over monthly intervals.
