How to Group Dates by Month and Year in Excel Pivot Table
When dealing with date-related data, grouping dates by month and year can provide a clearer picture of trends and patterns. In this guide, we’ll explore the step-by-step process to group dates by month and year seamlessly within an Excel Pivot Table, empowering you to unlock deeper insights from your data.
Group Dates by Month and Year Both in Pivot Table in Excel
In this data set, I have presented the sales report in the form of a Pivot Table. We have invoice data by category. Then, we have sales value by quantity for each product. Next, I will group the data by month and year below in the pivot table.

To group dates by month and year in the Pivot Table, go through the steps below:
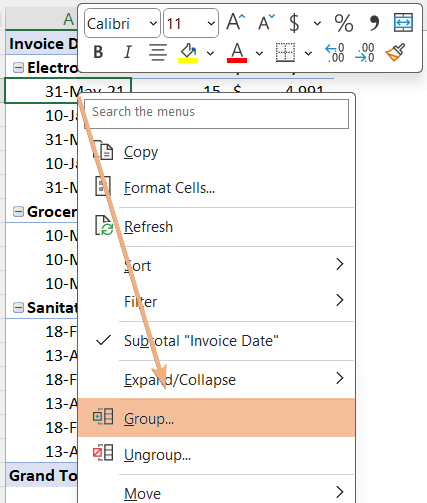
- Select a cell containing a date inside the Pivot Table.
- Right-click on that cell.
- Select Group from the Context Menu.

- Select Months and Years both in the Grouping dialog box.
- Click OK.

Afterward, you can see that I have grouped the dates by month and year.

Group Dates Only by Month in Pivot Table in Excel
- Click on any cell that contains a date value within the Pivot Table.
- Now, right-click on the cell to open the Context Menu.
- Click on Group option.

- Now, choose Month in the Grouping dialog box.
- Hit OK.

After going through these steps, you will see the grouped dates by Month in the Pivot Table in Excel.

Group Dates Only by Year in Pivot Table in Excel
- Select any cell containing a date in the Pivot Table.
- Right-click on the cell to access the Context Menu.
- Click on Group.

- Then, select Years in the Grouping dialog box and click OK.

Now, you see the scenario. Finally, we have grouped the dates by year in the Pivot Table.

Conclusion
In conclusion, grouping dates by month and year in an Excel Pivot Table is a powerful feature that enhances data analysis and presentation. By organizing data in a more granular manner, users can gain valuable insights into trends and patterns over specific months and years. This simple yet effective technique optimizes the visualization of time-based data, providing a clearer understanding of the underlying information. In this article, I have provided instructions on how to group dates by both month and year simultaneously, as well as individually. I hope that this article will serve as a comprehensive guide for grouping dates in an Excel Pivot Table.
Frequently Asked Questions
How do I format month and year in a Pivot Table?
To format month and year in a Pivot Table, follow these steps:
- Right-click on any date within the Pivot Table.
- Select Format Cells.
- In the Format Cells dialog box, choose the desired date format (e.g., “mm:yyyy” for abbreviated month and year).
- Click OK.
By following these steps, you can effectively format and group dates by month and year in your Pivot Table, providing a clearer and more organized presentation of time-based data.
Why is my pivot table not grouping dates?
If your Pivot Table is not grouping dates, ensure that your date column is formatted correctly. Right-click on the date column, choose Format Cells and set it as a date. Afterward, try grouping the dates again by right-clicking on a date cell, selecting Group, and choosing the desired grouping options, such as days, months, or years. If the issue persists, check for any blank cells or non-date values in the date column that might be preventing proper grouping. Correcting these issues should enable successful date grouping in your Pivot Table.
How do you pivot dates?
Pivoting dates in Excel involves transforming a date-based column into a more organized structure within a Pivot Table. Follow these steps:
- Select the range of cells containing your date data.
- Go to the Insert tab and click on PivotTable.
- In the PivotTable Fields, drag the date field to the Rows area.
- Optionally, you can drag the date field to the Values area to perform calculations.
Excel will automatically group the dates based on the level of detail you’ve chosen. This process allows you to pivot or rearrange your date data to gain insights and perform analyses more efficiently in a Pivot Table.
How do I show the full date in a pivot table?
To show the full date in a Pivot Table in Excel, follow these steps:
- Click on any cell within your Pivot Table.
- Go to the PivotTable Analyze tab in the ribbon.
- Click on Field Settings.
- In the Field Settings dialog box, select the Number Format button.
- In the Format Cells dialog box, choose the Date category.
- Select the desired date format, including the one that displays the full date.
- Click OK to apply the changes.
This process ensures that the full date is displayed in your Pivot Table.


