How to Group Pivot Table by Month in Excel [Step-by-Step]
Step 1: Insert Pivot Table to Group Pivot Table by Month in Excel
In this dataset, I have a sales report with invoice date. First, insert a Pivot table to group by month.

To do that, follow the instructions:
- Select the data range.
- Then, go to Insert tab > PivotTable option > From Table/Range.
- Confirm the table range and click OK.
- Choose the location to place the Pivot Table.
It will insert a Pivot Table in the Excel worksheet.
Step 2: Disable Automatic Date Grouping in Pivot Table
To disable automatic date grouping in the Pivot Table, follow the procedure below:
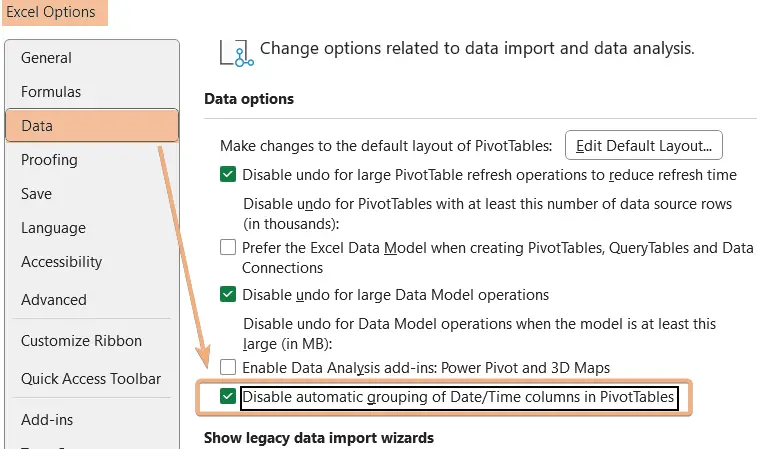
- Go to File tab> select Options.
- Now, navigate to Data tab in the Excel Options dialog box.
- Check on the “Disable automatic grouping of Date/Time columns in PivotTables” and click OK.

It will disable automatic date grouping in Excel.
Step 3: Drag Date and Arrange Data to Group Pivot Table by Month
Let’s organize the Pivot Table data and insert the date to the Pivot Table before grouping by month in Excel. To do that, go through the process below:
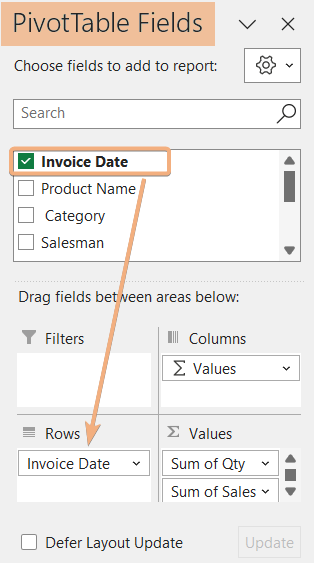
- Click on the Pivot Table to show the PivotTable Fields.
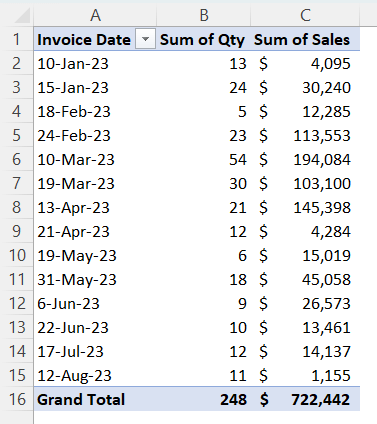
- Drag the Invoice Date from fields to Rows. Then, organize the Pivot Table by dragging fields to the areas.

This will insert a Pivot Table in the Excel worksheet.
Step 4: Group Pivot Table by Month in Excel
Now, we will learn to group Pivot Table by Month in Excel. So, go through the process below:
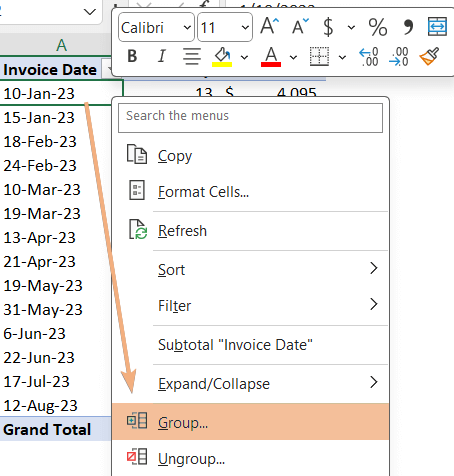
- Select a cell containing a date in the Pivot Table.
- Right-click on the cell and choose Group.

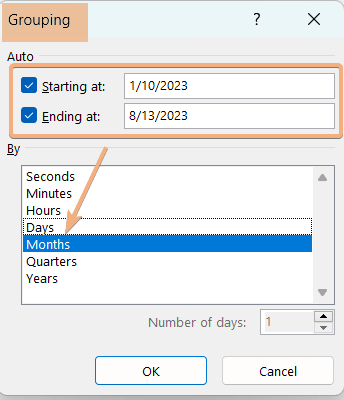
- In the Grouping dialog box, specify the starting and ending date.
- Then, choose Months in the box named By and click OK.

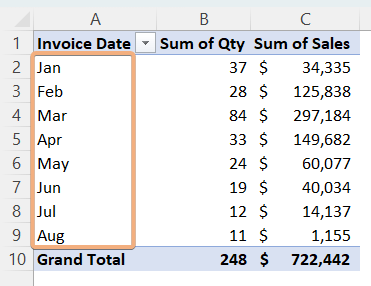
By following the above steps, you will see the grouped Pivot Table by Month in Excel.
Conclusion
In conclusion, grouping the Pivot Table by month in Excel is very helpful while dealing with large datasets. In large datasets, if you group Pivot Table by month, it will be precise to analyze data and observe the patterns and trends. So, I have added a guideline to group Pivot Table by month in Excel. Additionally, you will learn to disable automatic date grouping in Excel by going through this article. So, just group your Pivot Table by month as per your need.
Frequently Asked Questions
Why is my Pivot Table not grouping dates?
Your Pivot Table may not be grouping dates for several reasons. Here are some common issues and solutions:
- Data Format: Check that the date column is formatted correctly as dates and format the cells as dates in the Home tab.
- Blank Cells: Remove or fill any blank cells in the date column with valid dates.
- Data Type Mismatch: Ensure all dates in the column have the same data type. Use functions like DATEVALUE or TEXT for conversion if necessary.
- Grouping Range: Select a single cell in the date column and try grouping again.
- Field List Organization: Verify that the date field is placed in the Rows or Columns area in the PivotTable Fields.
- PivotTable Cache: Refresh the PivotTable or recreate it to clear any cache-related problems.
- Invalid Dates: Remove or correct any invalid dates present in the date column.
By following these steps, you can troubleshoot and resolve issues preventing the grouping of dates in your Pivot Table.
How do I group by week in a Pivot Table?
To group by both week and month in a Pivot Table, follow these steps:
- Select the data range you want to analyze.
- Go to the Insert tab and click on PivotTable.
- Drag the date field to the Rows area in the PivotTable Fields.
- Right-click on any date in the PivotTable and choose Group from the context menu.
- Select Weeks and click OK.
Now, your PivotTable should display data grouped by week. Adjust the layout and formatting as needed for your analysis.
How do you pivot dates?
To pivot dates in Excel:
- Click on the column header of the date column.
- Go to the Insert > PivotTable
- Drag the date field to the Rows area in the PivotTable Fields. Optionally, you can drag another date field to the Columns area for additional grouping.
- Right-click on any date in the Pivot Table.
- Choose Group option from the Context Menu.
- Select the desired grouping period (e.g., Months, Quarters, Years) and click OK.
Now, your PivotTable is pivoted by date, allowing you to analyze data based on the specified periods. Adjust the layout and formatting as needed for your analysis.
Why does Pivot Table not show month?
If a Pivot Table is not showing months as expected, you can troubleshoot the issue by following these steps:
- Ensure that the date column in your source data is formatted as a date. Right-click on the date column, choose Format Cells and select the appropriate date format.
- Make sure that the date field is placed in either the Rows or Columns area of the PivotTable.
- Right-click on any date cell in the Pivot Table and choose Group from the context menu.
- Select the desired grouping (e.g., Months) and click OK.
- Confirm that the data range for the Pivot Table includes the entire date column.
- If you’ve made changes, refresh the Pivot Table to ensure the latest data is reflected.
- Right-click on any date cell in the Pivot Table and go to Field Settings.
- Ensure that the correct date aggregation (e.g., Summarize value field by: “Month”) is selected.
By addressing these points, you should be able to resolve issues where the Pivot Table is not displaying months correctly.
