2 Ways to Group By Different Intervals in Excel Pivot Table
In this dataset, we have sales data. Here, we have product names and categories with their quantity and sales value. Now, I am going to group by different intervals in the Excel Pivot Table.

Using Helper Column to Group by Different Intervals in Excel Pivot Table
To group by different intervals in the Excel Pivot Table, you can insert a helper column. To do that, you have to prepare the dataset. Then, you can create a helper column and group data in the Pivot table. So, let’s start.
Step 1: Create a Helper Column Using the Nested IF Function to Group Data by Different Intervals
Now, create a helper column using the nested IF Function to group data by different intervals. First, I will build the formula and then will apply it to the helper column.
Syntax
=IF(condition1, value_if_true1, IF(condition2, value_if_true2, IF(condition3, value_if_true3, value_if_false)))Formula
=IF(D2<40000, "$0-$40000",IF(D2<80000, "$40001-$80000",IF(D2<120000,"$80001-$120000", "$120000++")))Formula Explanation
This formula categorizes values in cell D2 into different sales ranges: “$0-$40000”, “$40001-$80000”, “$80001-$120000”, and “$120000++”. The structure is similar to nested IF statements, where each condition is checked in sequence until one is true, and the corresponding result is returned.
To insert a helper column, follow the steps below:
- Insert a new column in the dataset.
- Copy the formula:=IF(D2<40000, “$0-$40000”,IF(D2<80000, “$40001-$80000″,IF(D2<120000,”$80001-$120000”, “$120000++”)))
- Paste the formula into the first cell of the new column.

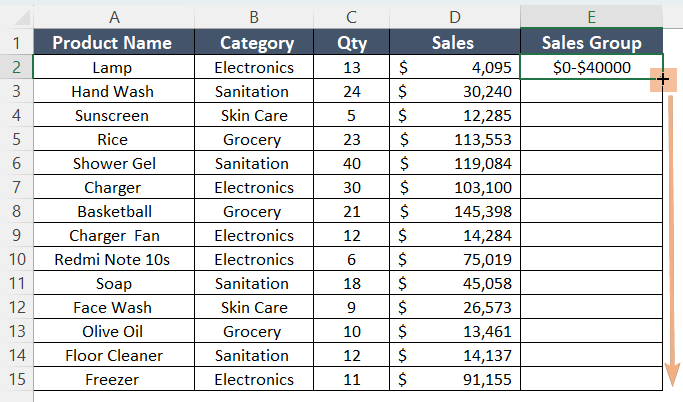
- Drag the Fill Handle to copy the formula down to the column.

Now, you can see a helper column. We have applied nested IF to create the column with different sales ranges in Excel.

Step 2: Create a Pivot Table to Group Data in Excel
Let’s insert a Pivot Table. Then, we can see the grouped intervals in the Pivot Table. So, go through the following steps:
- Select the data range.
- Go to Insert tab >PivotTable option > From Table/Range.

- Then, confirm the selected data range and location to place the Pivot Table.
- Click OK.
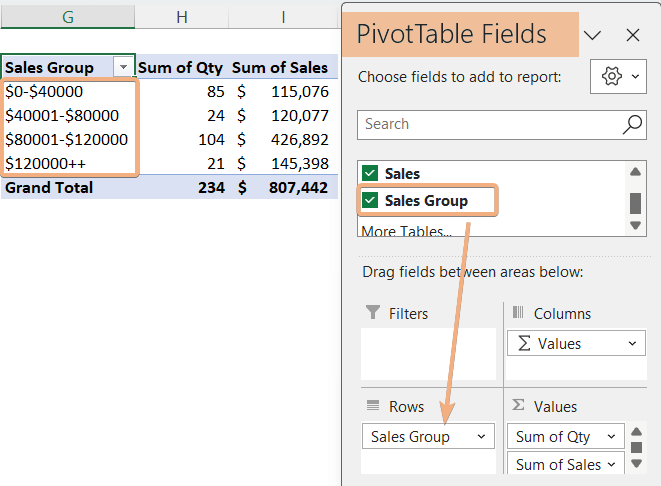
- Now, drag the fields to the areas in the PivotTable Fields to organize the Pivot Table.
So, you can see the grouped different intervals in the Pivot Table with the use of a helper column in Excel.

Group by Different Intervals with Pivot Table Grouping in Excel
In this part, we will explore to group by different intervals with Pivot Table grouping in Excel. Insert a Pivot Table from the dataset first. Next, drag fields and arrange Pivot Table from PivotTable Fields. Then, follow the instructions below:
- Select any cell within the Pivot Table.
- Right-click on that cell to access the Context Menu.
- Click on the Group option.

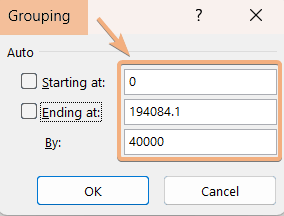
- Enter the Starting at and Ending at values manually in the Grouping dialog box.
- Specify the difference between each range in the next (By:) box.
- Click OK.

See the image. I have grouped the Pivot Table by different intervals using the Pivot Table Group tool.

Conclusion
In conclusion, grouping data by different intervals is a powerful method for enhancing data analysis. This intuitive feature empowers users to customize groupings based on specific criteria, facilitating a more nuanced and insightful exploration of their data. In this article, I have described 2 ways to group by different intervals in the Excel Pivot Table. The first one includes the intervals in the source data. The next one includes the Pivot Table group to group by different intervals in Excel. Hence, you can group by different intervals effortlessly by going through this guideline.
Frequently Asked Questions
How do I collapse multiple groups in a Pivot Table?
To collapse multiple groups in a Pivot Table in Excel, use the following steps:
- Begin with a visible and expanded view of your Pivot Table, displaying all groups.
- Click the small minus sign (-) next to the desired group name in the Rows or Columns area to collapse a specific group.
- Right-click on any cell within the group you want to collapse.
- Choose Collapse > Collapse Entire Field from the context menu to collapse all groups simultaneously.
By following these steps, you can effectively collapse multiple groups in a Pivot Table in Excel, providing a more concise view of your summarized data.
How do you update the range of multiple pivot tables?
To update the range of multiple Pivot Tables in Excel, you can follow these steps:
- Hold down the CTRL key on your keyboard.
- Click on each Pivot Table you want to update.
- Go to the PivotTable Analyze tab on the Excel ribbon.
- Click on Change Data Source or a similar option.
- In the Change PivotTable Data Source dialog box, modify the range to include your new data.
- Click OK to confirm.
- After updating the data source, right-click on any Pivot Table.
- Choose Refresh to apply the changes.
By following these steps, you can efficiently update the range for multiple Pivot Tables in Excel.


