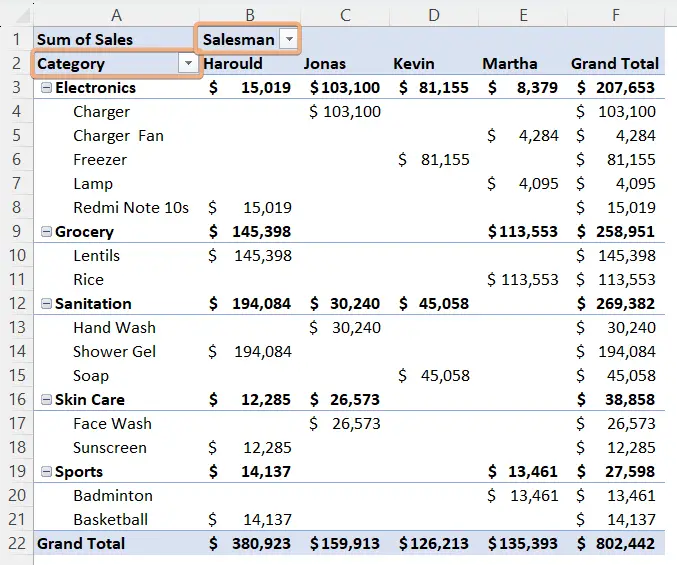
How to Filter Values in Pivot Table in Excel [4 Methods]
In the Pivot Table, you will need to filter items based on the sales amount, category, quantity, and so on. Fortunately, Excel has multiple features to filter values in pivot tables in Excel. In this article, you will find 4 methods to filter values in Pivot Tables in Excel. Here you will also find different types of filters in a pivot table. So, let’s begin the journey of learning to filter value in Pivot Tables in Excel.
Add Filter in Pivot Table in Excel
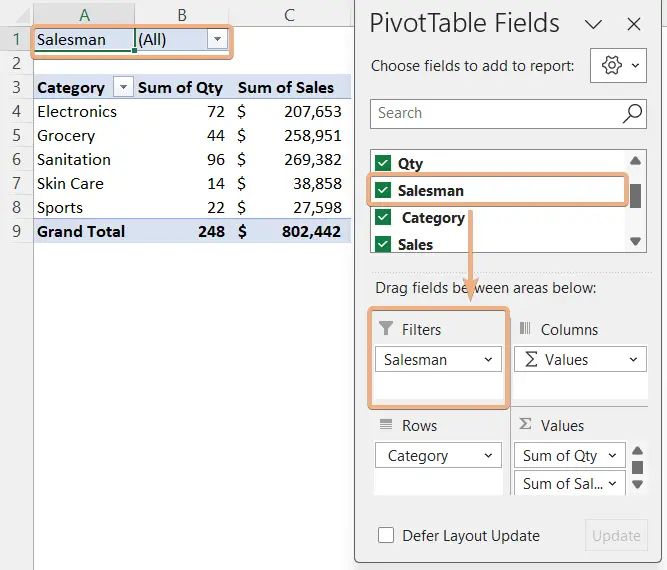
I have a pivot table of a sales report. Here, I have the quantity and sales of each category.
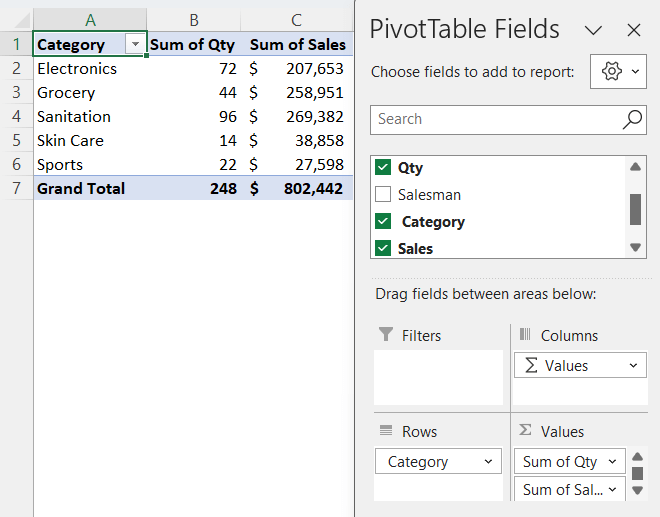
I want to add the salesman in the Filters section in the PivotTable Fields. So, I can optimize the performance of each salesman.
- Firstly, put the cursor on the salesman field.
- Next, drag it to the Filters section.
Afterward, you will see the added filter in the pivot table.

Types of Filters in Pivot Table in Excel
Excel offers different types of filters in a pivot table. You can choose your filter type, such as label filters, values filters, row labels, column labels, etc.
1. Label Filters
Label Filters help you to filter text-based data in the pivot table. For example, if you want to apply conditions to some specific items, you better use label filters.
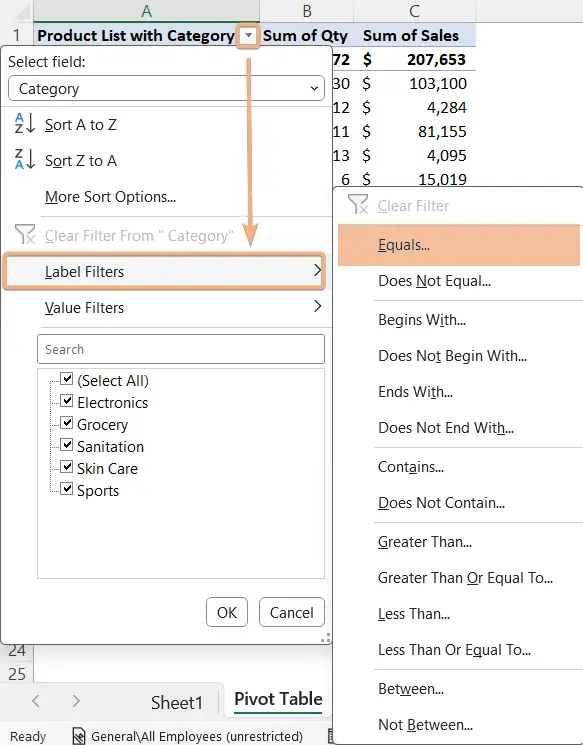
To access the Label Filters, click on the dropdown of the row labels. Now, choose Label Filters command.
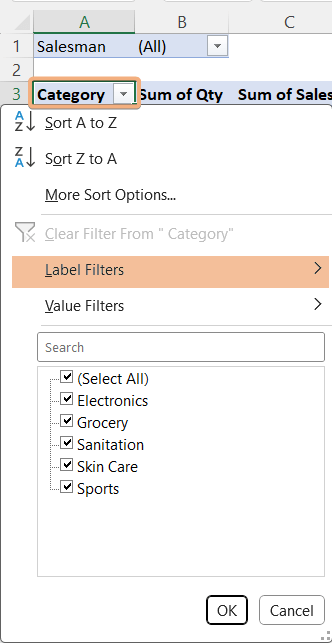
Afterward, you will see the following options in Excel. Now, you can choose filters as per your needs.

2. Value Filters
Value Filters filter the values, and show or hide values according to applied conditions in the pivot table. For instance, I can filter a specific sales data column to show only the sales of more than $400. As a result, it will show sales greater than $400 and hide the rest of the data.
To get the option of Value Filters, hit the dropdown of the row labels. Now, select Value Filters command.
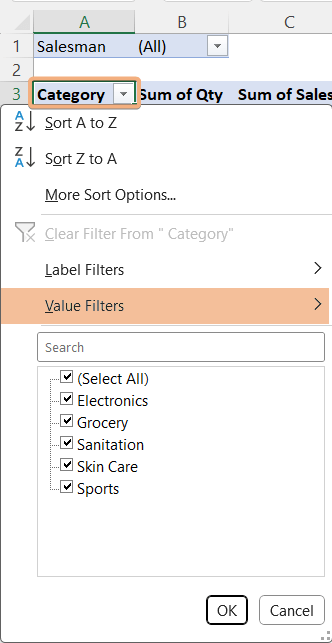
If you go to this option, you will see the selection lists.

3. Row Labels Filter
Row Labels filter the data of rows in a pivot table. To access these row labels, you can just tap on the dropdown of row labels. See the image, the category option is for filtering the rows.

Now, you can choose the row options. Here category is the row label. For example, if I want to see the grocery and electronics details, I will check on the options and uncheck others.
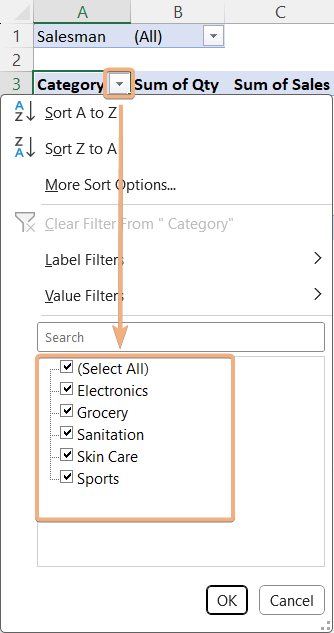
4. Column Labels Filter
Column Labels filter the data of columns in a pivot table. To access these row labels, you can just tap on the dropdown of row labels. See the image, the category option is for filtering the columns.
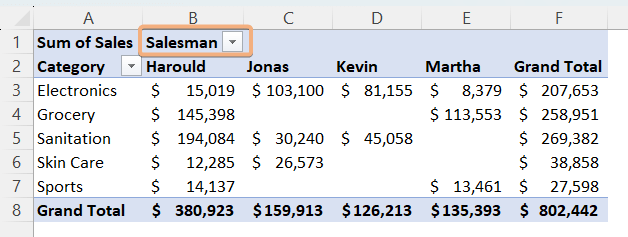
Now, you can choose the column options. Here, the salesman is the column label. For example, if I want to see the two employee details, I will check on the names and uncheck others.
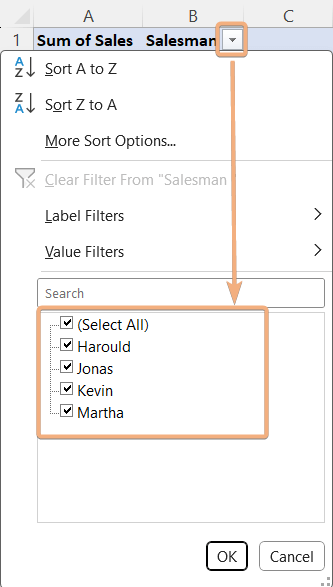
5. Report Filters
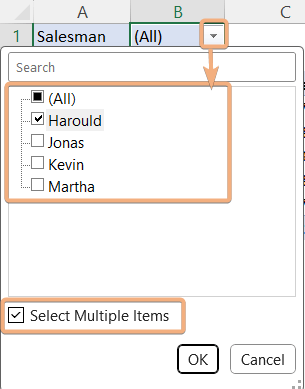
Report Filters are on the top of the pivot table. You can place one or more items from the list in this filter. To access this, drag the field name to the Filters section.
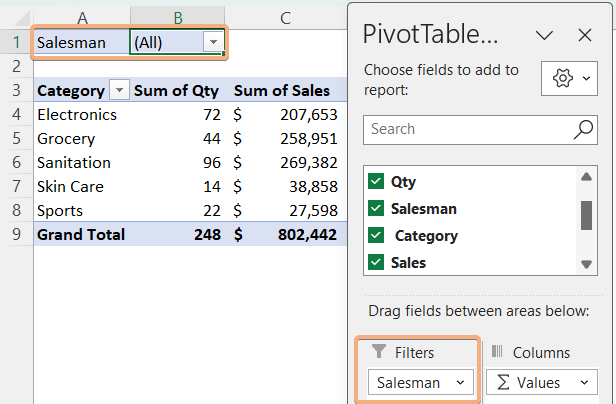
Now, choose the options. Here, the salesman is a report filter. For example, if I want to see the sale details of a salesman Harould. So, I check on that name and uncheck others.
6. Slicer Filters
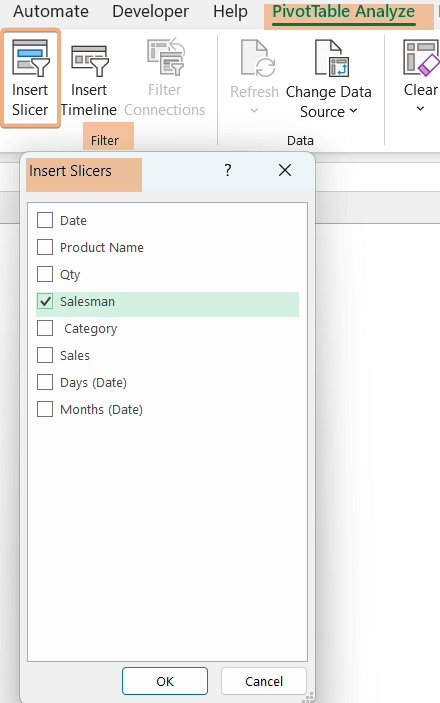
In a pivot table, you can choose slicer filters from the list. To do that:
- Click a cell on the pivot table.
- Then, go to the PivotTable Analyze tab.
- Next, click on Insert Slicer tool from the Filter group.
- Now, choose the field from the list of Insert Slicers dialog box.

Here, I have chosen Salesman. So, it will show the list of the salesman. You can filter data from this list.

7. Timeline Filters
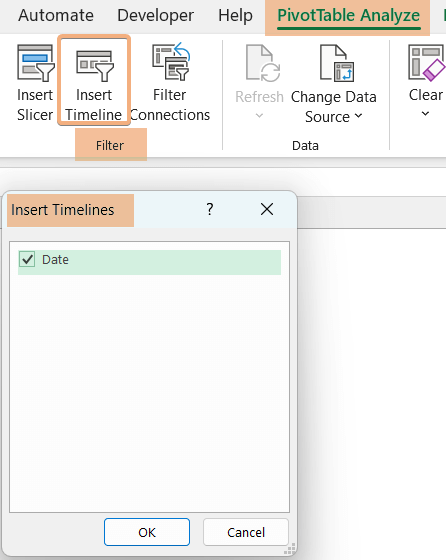
In a pivot table, if you have date, month, year, and time, you can choose timeline filters from the list.
- Click a cell on the pivot table.
- Then, go to the PivotTable Analyze tab.
- Next, click on Insert Timeline tool from the Filter group.
- Now, choose the field from the list of Insert Timelines dialog box.

Now, you will see the timeline of the date. You can filter the data based on period.

Filter Data Using Label Filters in Pivot Table in Excel
I have a sales report here. I have a list of product names with categories. Here, we have the sum of quantity with sales values.
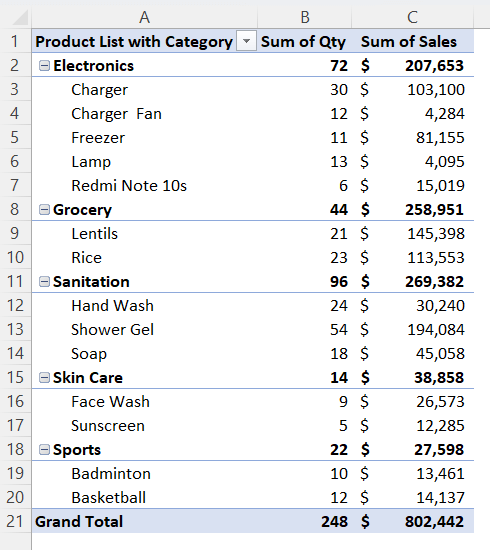
Now, I want to filter the list with only electronics products. Follow these steps:
- Firstly, click on the dropdown of row labels.
- Then, select Label Filters command.
- Next, click on the equals option.

- Now, insert the desired category name in the Label Filter dialog box and click OK.

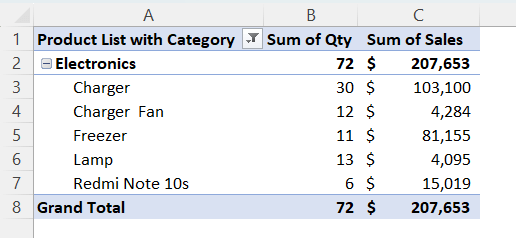
The result is here. We have filtered the data of product names in the electronics category.
Filter Data by Value Filters in Pivot Table in Excel
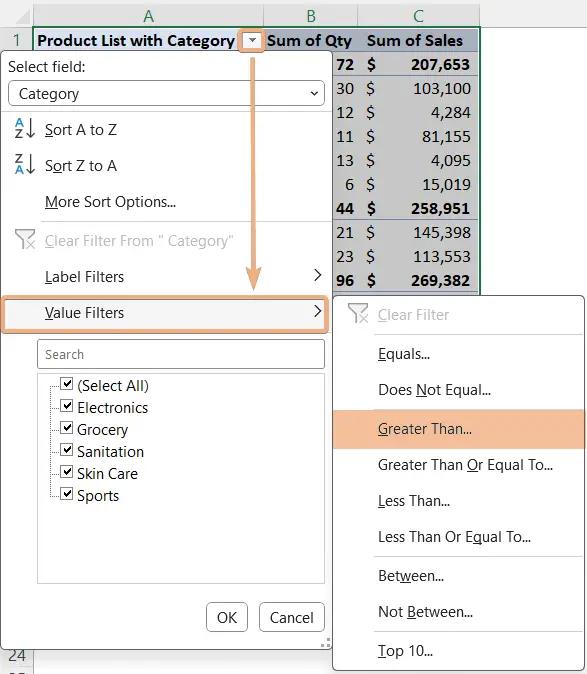
If you want to filter the data according to value, you can use Value Filters in the pivot table in Excel. I want to filter products that have sales greater than $15000. Now, follow the guides below:
- At first, click on the dropdown of row labels.
- Then, select Value Filters command.
- Next, choose the Greater than option from the list.

- Choose the items first and then, insert the number with the unit to filter the data in the Value Filter dialog box.
- Then, click OK.

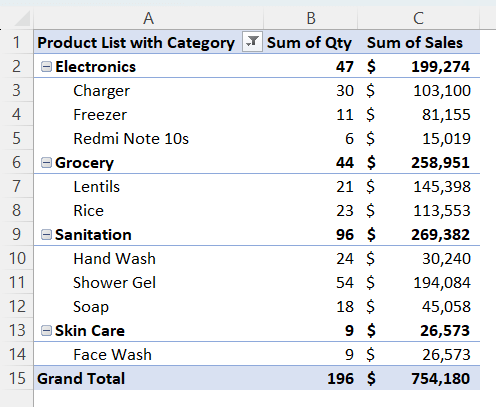
You have filtered data of the sum of sales which are greater than $15000. The rest data will be hidden.

Filter by Row in Pivot Table in Excel
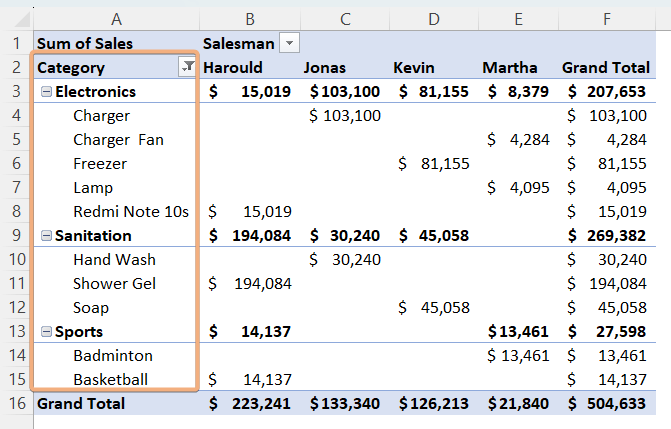
I want to filter the sales report based on category and salesman. In this pivot table, the row label is the category.
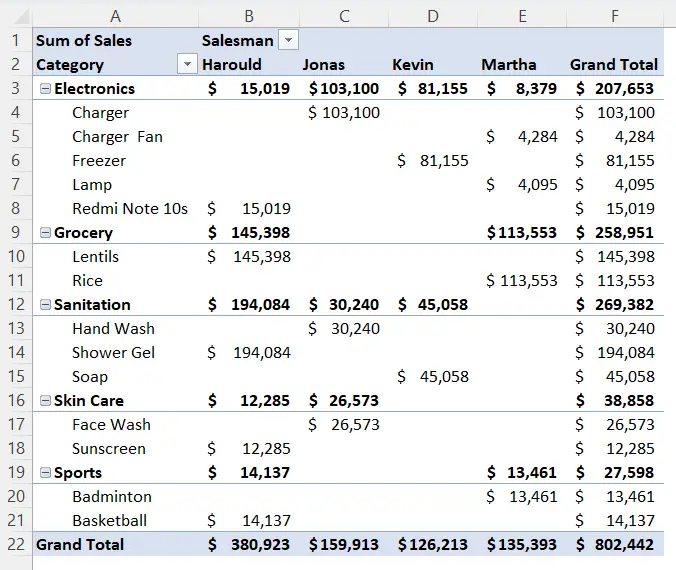
To filter by row in Pivot Table in Excel:
- Firstly, click on the dropdown of the row label.
- Next, check on the options you want to choose. Then, uncheck others.
- Click OK.

You will see the filtered result now. Here, we got data for electronics, sanitation, and sports data.
Filter by Column in Pivot Table in Excel
In this dataset, we will filter data by column. Here the column label is salesman. Now, I want to filter data for Harould and Kevin.
To filter the column value, go through the process below:
- Initially, hit the dropdown of the column labels.
- Then, choose the desired name from the lists.
- Now, click OK.

Here is the filtered result. Hence, we got the sales data for Harould and Kevin.

Clear Filters in Pivot Table in Excel
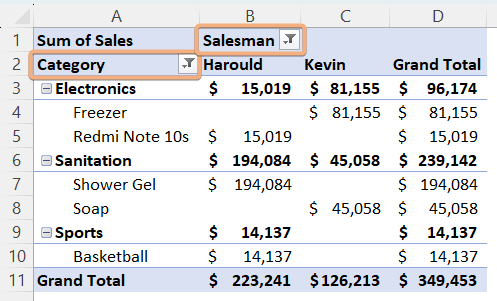
You will need to show the hidden data after filtering a pivot table in Excel. So, you have to clear all filters in Excel. In the following dataset, there are row labels and column label filters. Now, we will learn to clear them.
Case 1: Clear Filters Individually
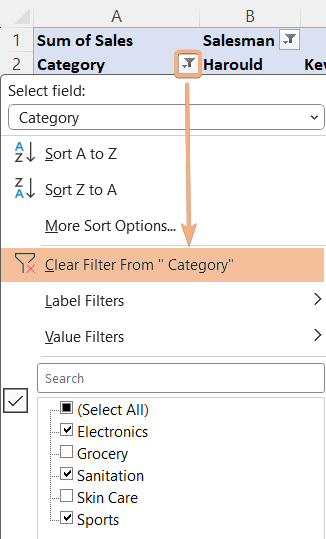
Sometimes, you have to clear filters of certain fields. For example, I want to remove the filter of the row labels here.
- Hit the dropdown for the row labels.
- Select the clear filter from the category options.

After that, you will see, you have cleared the row labels. However, there are still column label filters.

Case 2: Using Clear Filters Button
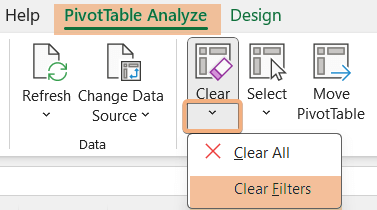
If you want to remove all filters at once, go through these steps:
- First, click any cell on the pivot table.
- Then, go to the PivotTable Analyze tab.
- Next, hit the dropdown of Clear from Actions tools.
- Now, select Clear Filters command.

Now, you have cleared all filters just in one click.

Conclusion
To sum up, you will face situations where you have to filter data in a pivot table. Basically, you have to optimize data or sales based on employees, date, timeline, category, and so on. In this article, I have discussed how to add filters in a pivot table in Excel. Moreover, I have described the types of filters in the pivot table in Excel. I have also included 4 ways to filter values pivot tables in Excel. If you want to remove the filter, I have also added guides describing two different cases in Excel. So, you will get a detailed guideline to filter values in pivot tables in Excel.
Frequently Asked Questions
How to filter top 10 values in pivot table?
To filter the top 10 values in a PivotTable in Excel:
- Select the field you want to filter within the PivotTable.
- Click the filter drop-down arrow next to the field name.
- In the filter options, choose Value Filters command.
- Select Top 10 option from the list.
- Specify whether you want to show the top or bottom values in the Top 10 Filter dialog box.
- Enter the number of items you want to display in the Top 10 Filter dialog box.
The Pivot Table will filter and display the top 10 values based on the selected field. Filtering for the top 10 values allows you to focus on the most significant data points in your Pivot Table.
How to filter out zero values in the pivot table?
To filter out zero values in a PivotTable in Excel:
- Select the field you want to filter within the Pivot Table.
- Click the filter drop-down arrow next to the field name.
- In the filter options, choose Value Filters.
- Select Does Not Equal from the list.
- In the Value Filter dialog, enter 0 as the value.
The Pivot Table will filter and display data, excluding zero values based on your criteria.
Filtering out zero values allows you to focus on data points that are not equal to zero, helping you analyze non-zero data more effectively.
How to filter pivot table values from largest to smallest?
To filter a Pivot Table from largest to smallest values in Excel:
- Click the drop-down arrow in the column header of the field you want to sort.
- In the Filter options, select Sort Largest to Smallest or Z to A if the data is text.
The PivotTable will be sorted in descending order, displaying the largest values first. This sorting option allows you to arrange your PivotTable data from the highest values to the lowest, making it easier to identify top performers or prioritize data.
How to filter unique values in pivot table?
To filter unique values in a PivotTable in Excel:
- Select the field you want to filter within the PivotTable.
- Click the filter drop-down arrow next to the field name.
- In the filter options, choose Value Filters.
- Select Equals from the list.
- In the Value Filters dialog box, enter the desired unique value from the field.
The PivotTable will filter and display only the unique values based on your criteria. Filtering for unique values allows you to focus on specific data points that occur only once within the field. This can help you identify distinct or uncommon values in your PivotTable data.
How to filter sum values in pivot table?
To filter sum values in a PivotTable in Excel:
- Select the field with sum values you want to filter within the Pivot Table.
- Click the filter drop-down arrow next to the field name.
- In the filter options, choose Value Filters.
- Select a filter criterion, such as Greater Than or Less Than, based on your sum values.
- In the Value Filters dialog box, enter the desired sum value.
The Pivot Table will filter and display data that meets the specified sum value criteria. Filtering for sum values allows you to focus on data points that meet specific aggregation criteria, such as values greater or less than a certain sum. This can be useful for analyzing data with specific sum thresholds.
