3 Steps to Calculate Weighted Average in Excel Pivot Table
In Excel, the weighted average is a calculated measure that considers the importance or weight assigned to each value in a dataset. It is derived by multiplying each value by its corresponding weight, summing these products, and dividing by the total sum of weights. This method allows for a nuanced analysis where certain data points contribute more significantly to the overall average. Excel’s user-friendly interface and built-in features enable users to easily perform and visualize weighted averages without complex formulas, making it accessible for diverse finance, statistics, and data analysis applications. In this article, I will calculate the weighted average in the Excel Pivot Table. Let’s begin to explore.
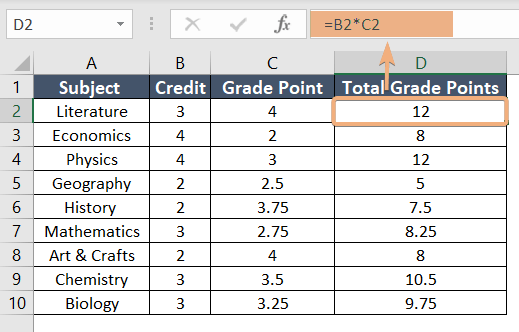
The dataset contains the grade points of a student. Besides, I have credit hours for each subject. Now, we will calculate a weighted average in the Excel Pivot Table.

Step 1: Prepare Dataset with a Helper Column
To begin with, I have to insert a helper column in Excel. In this column, I will multiply the credit with grade points for each subject. To do that, follow the steps:
- Insert a helper column next to the dataset.
- Select a cell.
- Insert a formula.
In this dataset, I have named the helper column Total Grade Points. Here, the formula is to multiply the credit and grade points.

Step 2: Create and Arrange a Pivot Table
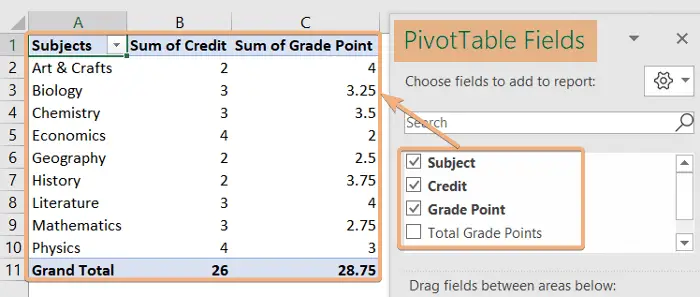
Create a Pivot Table from the dataset. Go through the procedure below:
- Select the ranges.
- Go to Insert tab > PivotTable tool > From Table/Range option.

- In PivotTable from table or range dialog box, confirm the range and location to place the Pivot Table.
- Click OK.

- Arrange the Pivot Table from the PivotTable Fields pane.

Step 3: Use Calculated Field to Create Formula for Weighted Average
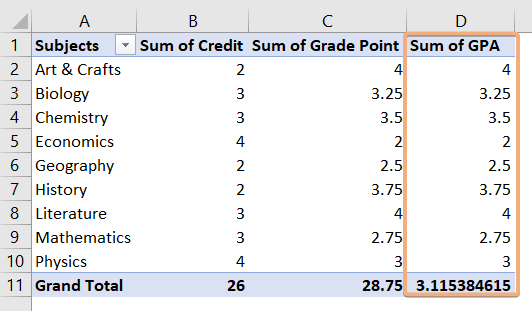
In this section, I will add a calculated field to calculate the weighted average in the created Pivot Table. Now, follow the steps below:
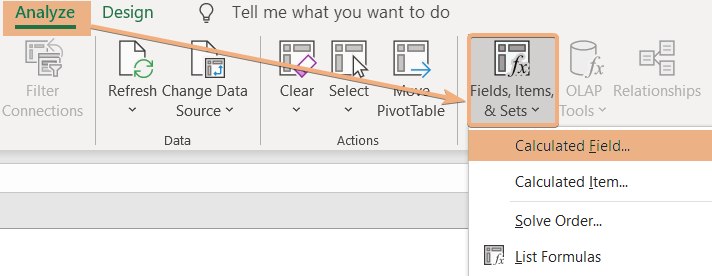
- Select any cell in the Pivot Table.
- Go to the Analyze tab in the Pivot Table tools.
- Next, navigate to the Fields, Items & Sets dropdown under the Calculations group.
- Select Calculated Field from the dropdown list.

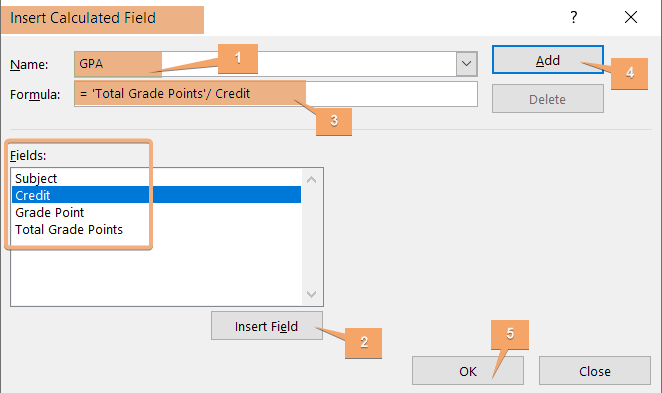
- In the Insert Calculated Field dialog box, enter a name and insert a formula with the list of fields.
- Click Add and hit OK.

After completing these steps, you will see an inserted column with the weighted average.
Conclusion
In conclusion, utilizing a weighted average in an Excel Pivot Table is a powerful and flexible tool for analyzing data when the significance of different values varies. By assigning weights to each data point and incorporating them into the calculation, you can obtain a more accurate and meaningful representation of the overall average. The PivotTable feature in Excel streamlines this process, providing a user-friendly interface to efficiently organize and analyze complex datasets. In this article, I have provided a step-by-step guideline to calculate the weighted average Excel Pivot Table.
Frequently Asked Questions
Why weighted average?
Weighted average assigns varying degrees of importance, or weights, to different data points in a set. It is calculated by multiplying each value by its corresponding weight, summing these products, and dividing by the total sum of weights. This method provides a more accurate representation of the central tendency, especially in scenarios where some data points contribute more significantly to the overall outcome. Weighted averages are commonly employed in finance, statistics, and various fields where certain values significantly influence the final result.
How do you write a weighted average?
To write a weighted average, use the formula: Weighted Average = ∑(Value×Weight) / ∑Weights.
Assign weights to each value, multiply each value by its corresponding weight, sum these products, and divide by the total sum of weights. This method accounts for varying degrees of importance among different data points, providing a more accurate representation of the central tendency. Commonly used in finance, statistics, and data analysis.
