How to Calculate Value at Risk in Excel [Step-by-Step]
What is Value at Risk (VaR)?
Value at Risk (VaR) is a statistical measure widely used in finance to assess the potential risk of financial investments over a specified time horizon. It provides an estimate of the maximum amount of money that a portfolio or investment is likely to lose with a certain level of confidence within a given time frame.
Key Components of VaR Include
- Time Horizon: VaR is calculated for a specific period, such as one day, one week, or one month. The choice of time horizon depends on the investor’s preferences and the nature of the assets being analyzed.
- Confidence Level: This represents the level of certainty associated with the VaR estimate. Common confidence levels are 95%, 99%, or other percentages. For example, a 95% VaR implies that there is a 5% chance that the actual loss could exceed the calculated VaR.
It’s essential to note that VaR has limitations. It assumes that financial returns are normally distributed and may not capture extreme events or sudden market changes effectively. Therefore, you should use VaR in conjunction with other risk measures and considerations to form a comprehensive risk management strategy. Despite its limitations, VaR remains a valuable tool for assessing and communicating risk in financial portfolios.
Steps to Calculate Value at Risk in Excel
Understanding and managing financial risk is a crucial aspect of effective portfolio management. One key metric in this realm is Value at Risk (VaR), which provides an estimate of the potential loss in a portfolio over a specific time period and confidence level.
Step 1: Prepare Dataset
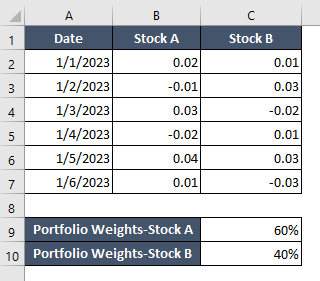
Let’s delve into the intricacies of the dataset. Stock A and Stock B showcase varying performance, experiencing both positive and negative returns on different days. Adding a layer of complexity, we introduce portfolio weights, illustrating the distribution of investment across Stock A and Stock B. So, there is a portfolio weight of 60% for Stock A and 40% for Stock B. Now, we aim to strike a balance that aligns with an investment strategy, reflecting the significance of each asset in the overall portfolio.
This dataset provides a practical foundation for the application of VaR calculations in Excel.

Step 2: Calculate Portfolio Returns in Excel
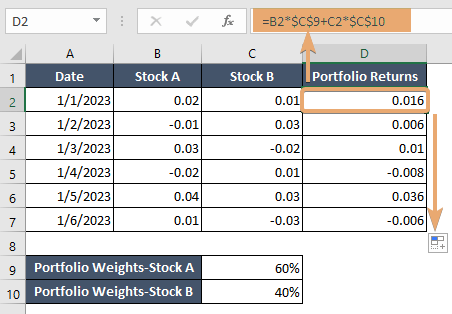
In a new column, let’s say “Portfolio Returns,” use the following formula to calculate the daily returns of the portfolio:
Portfolio Return=(Stock A Return* Portfolio Weight A)+(Stock B Return*Portfolio Weight B)- In Excel, you can use a formula like this: =B2*$C$9+C2*$C$10
Assuming your data starts in row 2, this formula calculates the portfolio return for each day. - After entering the formula in the first cell of the “Portfolio Returns” column, drag it down to apply the formula to all rows in your dataset.
This will automatically calculate the portfolio return for each day based on the given weights and individual stock returns.
Following these steps, you can efficiently calculate daily portfolio returns in Excel. This process lays the groundwork for various financial analyses. It includes the calculation of metrics like VaR and Sharpe Ratio, aiding in effective portfolio management and risk assessment.

Step 3: Calculate VaR in Excel
Calculating Value at Risk (VaR) in Excel involves determining the potential loss in a portfolio over a specific time period and confidence level. The formula is below to find VaR:
VaR=PERCENTILE(Portfolio Returns,1−Confidence Level)Here are the step-by-step instructions:
- Ensure your dataset is well-organized with columns for dates and daily portfolio returns.
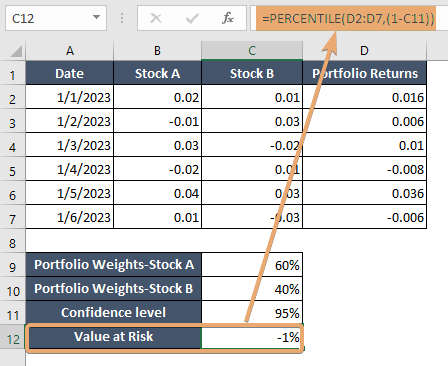
- Decide on the confidence level you want for your VaR calculation assuming the confidence level is 95%.
- Utilize the PERCENTILE function in Excel to find the desired percentile of the portfolio returns. The formula would look like this: =PERCENTILE(D2:D7,(1-C11))
For example, if your portfolio returns are in column F starting from row 2, and your confidence level is 95%, the formula would be: =PERCENTILE(F2:F100, 0.05)
This formula calculates the VaR at the chosen confidence level based on your historical portfolio returns.
Following these steps, you can calculate VaR in Excel based on your portfolio’s historical returns and chosen confidence level. This information is valuable for investors and financial professionals seeking. Hence it will help to manage and mitigate risks associated with their investment portfolios.

Pros and Cons of Value at Risk
While VaR is a widely used tool for risk assessment and management, its limitations should be acknowledged. It is most effective when used in conjunction with other risk metrics and qualitative analysis to provide a comprehensive understanding of the potential risks associated with an investment portfolio.
Pros of Value at Risk (VaR):
- Quantitative Measure: VaR provides a quantitative measure of potential financial loss, allowing investors to assess and communicate risk numerically.
- Standardized Comparison: VaR allows for standardized comparisons of risk across different portfolios or investment strategies, facilitating decision-making.
- Risk Management Tool: It serves as a valuable tool for risk management, enabling investors to set risk limits and make informed decisions about asset allocation.
- Widespread Adoption: VaR is widely used in the financial industry, making it a common language for expressing and understanding risk among professionals.
- Sensitivity Analysis: VaR can be used in sensitivity analysis to evaluate the impact of changes in market conditions on a portfolio.
Cons of Value at Risk (VaR):
- Assumption of Normal Distribution: VaR assumes that financial returns are normally distributed, which may not hold true during extreme market events or crises.
- Limited Time Horizon: VaR provides a snapshot of risk over a specific time horizon, potentially overlooking long-term risks that may unfold over extended periods.
- Ignores Tail Risk: VaR may not effectively capture tail risk or the probability of extreme events, which can lead to underestimation of potential losses during rare but severe market conditions.
- Dependence on Historical Data: The accuracy of VaR depends on the availability and reliability of historical data, and it may not account for unprecedented market situations.
- Single-Point Estimate: VaR provides a single-point estimate of risk, which may oversimplify the complex dynamics of financial markets and fail to capture the full range of potential outcomes.
Conclusion
Calculating Value at Risk in Excel empowers investors to quantify and manage potential financial losses. By following these steps and leveraging Excel’s functions, you can gain valuable insights into the risk associated with your investment portfolio. Stay informed, make data-driven decisions, and navigate the complex world of finance with confidence.
Frequently Asked Questions
How to convert 1-day VaR to 10-day VaR?
Convert 1-day VaR to 10-day VaR using the square root of time rule: 10-day VaR = 1-day VaR * √10. For example, if your 1-day VaR is $100, the estimated 10-day VaR would be approximately $316.20. This formula assumes a normal distribution of returns and scales the risk over time.
Is a High VaR a Good Thing?
A high Value at Risk (VaR) is generally not considered a good thing in finance. VaR measures the potential maximum loss in a portfolio at a certain confidence level over a specified time horizon. A higher VaR implies a greater potential for significant losses, indicating higher risk.
Investors and risk managers often aim for a balance between risk and return. A high VaR may suggest that the portfolio is exposed to greater market volatility, increasing the likelihood of substantial losses. In contrast, a lower VaR indicates a more conservative approach with potentially lower returns but reduced exposure to risk.
It’s crucial to interpret VaR in the context of the investor’s risk tolerance, investment objectives, and the nature of the assets involved. While a certain level of risk is inherent in investing, a consistently high VaR may signal the need for a reevaluation of the portfolio’s composition or risk management strategies. It’s advisable to complement VaR analysis with other risk metrics and consider the broader financial context when making investment decisions.