How to Calculate Cumulative Cash Flow in Excel [Step-by-Step]
What is Cumulative Cash Flow?
Cumulative Cash Flow is the running total of cash inflows and outflows over a specific period. It provides a comprehensive view of your financial position by summing up all the cash transactions up to a given point in time. Excel, with its versatility and user-friendly interface, makes it easy for individuals and businesses to track and analyze their cumulative cash flow.
Steps to Calculate Cumulative Cash Flow in Excel
Effective financial management requires a clear understanding of cash flows. In this guide, we’ll walk you through the steps to calculate Cumulative Cash Flow in Excel, providing valuable insights into your financial position over time.
Step 1: Set up Your Data
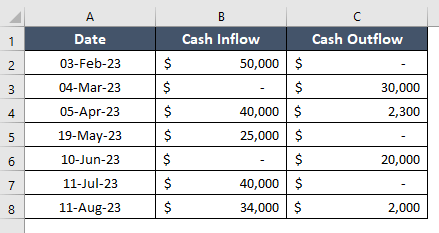
Begin by organizing your financial data in Excel. Create columns for the date, cash inflows, and cash outflows. In this dataset, the “Date” column represents the dates of the transactions. The “Cash Inflows” column contains the amount of cash received on each date and the “Cash Outflows” column contains the amount of cash spent on each date.

Step 2: Calculate Net Cash Flow
To calculate net cash flow in Excel, go through these steps:
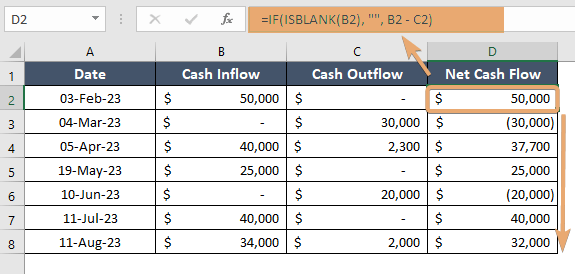
- In an empty cell, enter the following formula: =IF(ISBLANK(B2), “”, B2 – C2)
This formula checks if the “Cash Inflow” for the current row (B2) is blank. If it is, it means there’s no cash inflow for that date, and the formula returns an empty string. Otherwise, it subtracts the “Cash Outflow” (C2) from the “Cash Inflow” (B2). - Drag this formula down for the entire column in Excel.
Now, your “Net Cash Flow” column (in column D) should display the difference between the “Cash Inflow” and “Cash Outflow” for each corresponding row. If there’s no cash inflow for a particular date, the cell in the “Net Cash Flow” column will remain blank.

Step 3: Calculate Cumulative Cash Flow
To calculate the Cumulative Cash Flow, you can use the “Net Cash Flow” column you just calculated. Assuming your “Net Cash Flow” column is in column D, follow these steps:
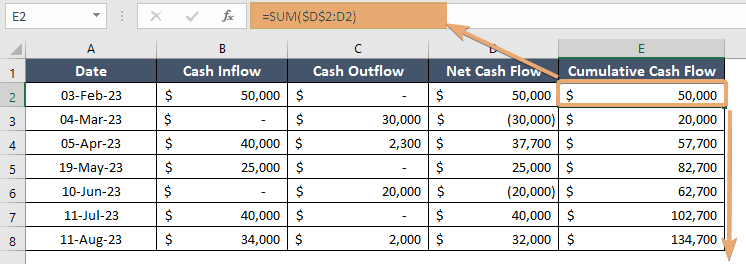
- In cell E2 (assuming row 1 has headers), enter the following formula: =SUM($D$2:D2)
This formula sums up all the values in the “Net Cash Flow” column from the first row to the current row, providing the cumulative cash flow. - Drag this formula down for the entire column in Excel.
Now, your “Cumulative Cash Flow” column (in column E) should show the running total of net cash flows up to each date. If there’s no net cash flow for a particular date, the cell in the “Cumulative Cash Flow” column will remain the same as the previous row.
This formula calculates the cumulative cash flow by summing up all the net cash flows up to the current row, giving you a comprehensive view of your cash position over time.

Conclusion
Mastering the art of calculating cumulative cash flow in Excel is an essential skill for financial management. This user-friendly guide has equipped you with the knowledge and step-by-step instructions needed to harness the power of Excel for accurate financial analysis. As you apply these skills, you’ll gain a deeper understanding of your financial position and empower yourself to make informed decisions for a prosperous financial future.
Frequently Asked Questions
How do you create a cumulative table in Excel?
To create a cumulative table in Excel, follow these steps:
- Ensure your data is organized in columns, with each column representing a variable or category.
- Insert a new column next to the data you want to cumulatively add.
- In the first cell of the cumulative column (let’s say B2), enter the formula:=SUM($A$2:A2)
- Adjust the cell references based on your actual data range. This formula adds up the values from the first row to the current row.
- Click on the bottom-right corner of the cell with the formula (the fill handle), and drag it down to apply the formula to the entire column.
Now, the cumulative column will show the running total for each row. The formula dynamically adjusts, summing the values as you drag it down.
For example, if your original data is in column A starting from A2, the cumulative column in column B would show the cumulative total. Adjust the references accordingly if your data is in a different location.
Is net cash flow cumulative?
Yes, Excel’s NPV (Net Present Value) function is accurate when used correctly. It calculates the present value of a series of cash flows, taking into account the time value of money.
The formula for NPV in Excel is NPV:
=CF0/(1+r)0+CF1/(1+r)1+…+CFn/(1+r)nWhere:
- CF0, CF1,…, CFn are the cash flows in different periods,
- r is the discount rate,
- n is the number of periods.
- To use Excel’s NPV function, you would input the discount rate and the cash flows into the formula. For example:=NPV(rate, CF0, CF1,…, CFn)
Make sure to include the initial investment as the first cash flow and use a consistent time interval for cash flows. The result represents the net present value of the investment.
Remember that accurate input data and understanding the context of your financial analysis are crucial for obtaining meaningful results with Excel’s NPV function.
What is the difference between NPV and PV in Excel?
In Excel, NPV (Net Present Value) and PV (Present Value) are related but serve different purposes in financial analysis.
PV (Present Value):
- PV calculates the present value of a single cash flow or an investment’s initial cost.
- Formula: PV= FV/(1+r)n
Where FV is the future value; r is the discount rate and n is the number of periods. - PV helps determine the current worth of a future amount, considering the time value of money.
NPV (Net Present Value):
- NPV calculates the present value of a series of cash flows, usually representing an investment or project.
- Formula: NPV=CF0/(1+r)0+CF1/(1+r)1+…+CFn/(1+r)n
Where CFn is the cash flow; r is the discount rate and n is the number of periods. - NPV helps assess the profitability of an investment by considering the time value of money and comparing the total present value of cash inflows and outflows.
In summary, PV is used for a single cash flow, while NPV is employed for a series of cash flows, making it more applicable for evaluating complex financial scenarios such as investment projects.