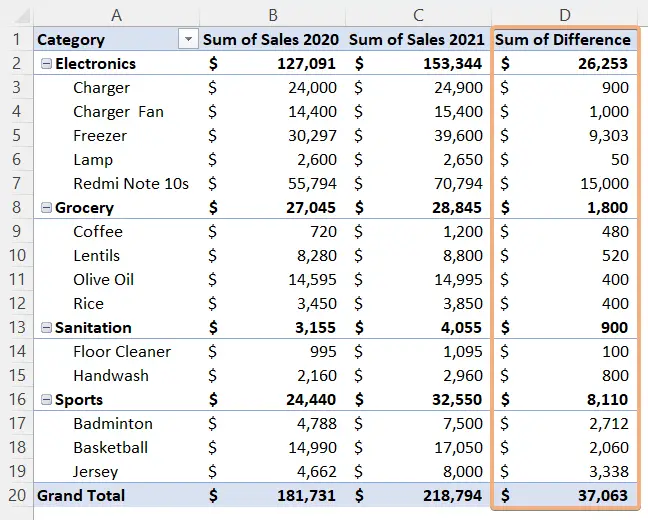
How to Find Difference Between Two Columns Using Pivot Table Calculated Field
To find the difference between two columns in a Pivot Table using Calculated Field, follow these steps:
- Select any cell inside the Pivot Table.
- Go to the PivotTable Analyze tab.
- Click on the Fields, Items & Sets dropdown, and select the Calculated Field option.
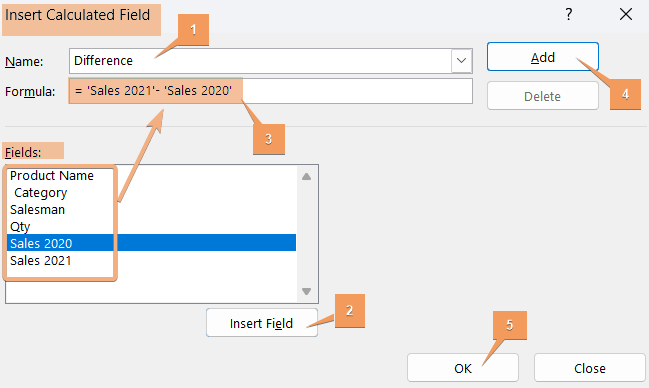
- In the Insert Calculated Field dialog box, enter a name for the new field.
- Select the field name from the Fields list.
- Click on Insert Field for each column you want to include in the calculation.
- Enter a minus (–) sign between the selected fields to represent the difference.
- Click on Add to add the calculated field.
- Click OK to confirm the changes.
After these steps, your Pivot Table will show a new column representing the calculated difference between the two columns.
In the dataset, we have a sales report. There are sales values with product names in two different years. Additionally, we have the number of products, categories, and the salesman in the data.

Step 1: Create a Pivot Table and Arrange the Pivot Table
Firstly, I will create a Pivot Table from the above dataset. Then, I will arrange the Pivot Table from the PivotTable Fields. Now, follow the steps below:
- Select the entire data range.
- Navigate to Insert tab > PivotTable dropdown > From Table/Range option.
- Choose the location to place the Pivot Table.
- Now, click on the field name and drag it into the areas section as per your need.
After following the above steps, you will see a created Pivot Table.

Step 2: Insert Difference in the Pivot Table Calculated Field
Let’s insert a column to see the difference between two columns in the Pivot Table Calculated Field. Here’s how:
- Select a cell inside the Pivot Table.
- Navigate to the PivotTable Analyze tab> Fields, Items & Sets dropdown > Calculated Field option.

- In the Insert Calculated Field dialog box, enter a formula name.
- Then, select the field name from the Fields section and click on Insert Field.
- Enter a minus(-) sign and click on other field > Insert Field to insert a column to add the difference.
- Hit Add and click OK.

After doing that, you will see the Pivot Table with an inserted difference between the two columns.

Conclusion
In conclusion, utilizing calculated fields in a Pivot Table to find the difference between two columns provides a powerful analytical tool in Excel. This feature empowers users to perform custom calculations that may not be directly available in the source data. In this article, I have provided a step-by-step guide to add differences between two columns in the Excel Pivot Table. So, just go through this article and add the calculated field difference as you want.
Frequently Asked Questions
How do I add a calculated field to a Pivot Table?
To add a calculated field to a Pivot Table in Excel, follow these steps:
- Click anywhere in the Pivot Table.
- Go to the PivotTable Analyze tab in the Excel ribbon.
- Select Fields, Items & Sets dropdown > Calculated Field option.
- In the Insert Calculated Field dialog box, enter a name for the new field.
- Formulate the calculation using existing fields by clicking on them and using operators.
- Click Add to include the calculated field.
- Press OK to apply and close the dialog box.
By following these steps, you can easily add a calculated field to your Excel Pivot Table, allowing you to perform custom calculations based on existing fields.
Can I use a Pivot Table to compare two lists?
Yes, you can use a Pivot Table to compare two lists in Excel. Here’s how:
- Create Pivot Table: Select any cell in your data range, go to the Insert tab, and click PivotTable. Choose where you want to place the Pivot Table.
- Drag Fields: Drag the common field you want to compare (e.g., product names, customer names) to both the Rows and Values area.
- Analyze Data: The Pivot Table will show the data summarized. You can easily compare the values side by side.
- Use Filters: Utilize filters to focus on specific data points or conditions.
By following these steps, you can effectively use a Pivot Table to compare two lists in Excel.
Can you show different calculations in Pivot Table value fields?
Yes, in a Pivot Table, you can display different calculations in the value fields. Here’s how:
- Create Pivot Table: Select any cell in your data range, go to the Insert tab, and click PivotTable. Choose where you want to place the Pivot Table.
- Add Fields: Drag the fields you want to analyze to the Rows and Values areas.
- Customize Value Field Settings: For each value field, click the drop-down arrow in the Values area and select Value Field Settings. Here, you can choose from various summary functions like Sum, Count, Average, etc.
- Show Values As: You can further customize by using the Show Values As option. Right-click on the value field, go to Show Values As and select the desired calculation, such as % of Grand Total or % of Column Total.
By following these steps, you can show different calculations for value fields in a Pivot Table.

