How to Add Running Total in Excel Pivot Table
- Click anywhere within the Pivot Table.
- Right-click and choose Value Field Settings.
- Select Show Values As option.
- Choose Running Total In from the dropdown list of Show value as.
- Select Base Field from the list.
These steps will help you create a Running Total for your data. Gain deeper insights into cumulative values and trends in your dataset using this feature.
What is Running Total in Excel?
A Running Total in Excel is a cumulative sum of values continuously updating as new data is added. It provides a running tally of values in a column or row.
To calculate Running Total in Excel:
- Select a cell next to the data you want to sum.
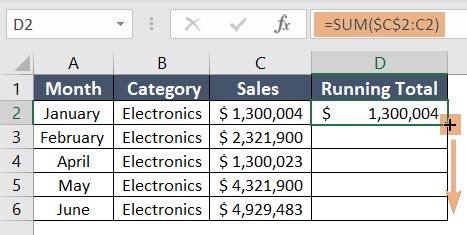
- Enter the formula: For a column, use a formula like =SUM($C$2:C2) where C2 is the first cell of your data. For a row, use =SUM(C$2:C2) with C2 being the first cell.
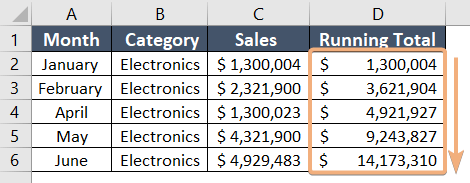
- Drag the Fill Handle down for columns or to the right for rows.

This creates a Running Total that updates automatically when new data is added.
How to Calculate Running Total in Excel Pivot Table
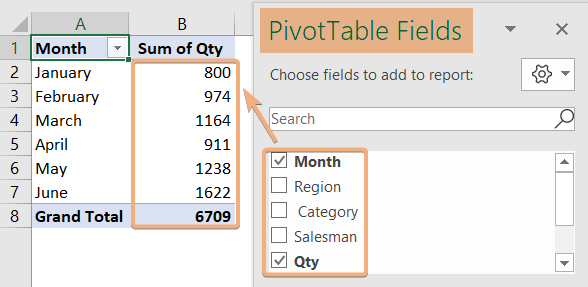
Excel Pivot Tables have multiple features to deal with data analysis and summarization. Pivot Table has the Value Field Settings tool to add running total. So, I have inserted a Pivot Table by selecting month and quantity from the PivotTable Fields.
To get Running Total in the Excel Pivot Table, go through the steps below:
- Select a cell inside the Pivot Table.
- Right-click on that and choose Value Field Settings.

- Choose Show Values As in the Value Field Settings dialog box.
- Click on the dropdown in the Show values as.
- Select Running Total In.
- Choose a Base Field from the list to add the running total.
Here, I chose Month for Base Field. - Click OK.

Here, we have got the running total in the same column named Sum of Qty.
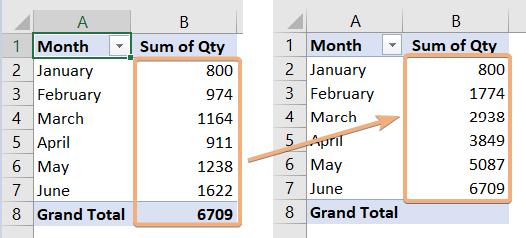
Calculate Running Total Starting from Zero in Excel Pivot Table
If you want to start the running total from zero, you have to enter dummy data with zero values in the source data. Now we will see how the running total starts from zero in the Excel Pivot Table.
To do that, go through the steps below:
- Enter dummy data with no values.
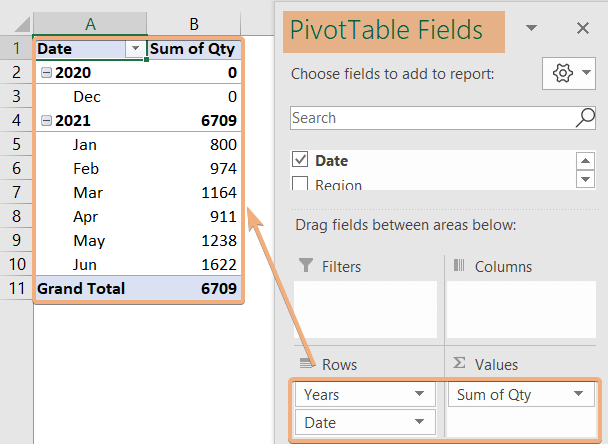
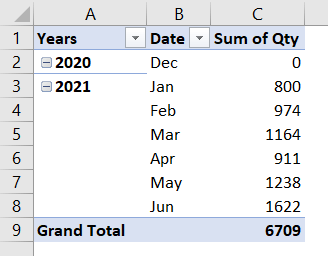
In this dataset, I have changed the monthly data to date values with no values.

- Then, select the data range.
- Insert a Pivot Table and arrange the Pivot Table.

To show it in a presentable way, I will organize it by showing it in tabular form. Hence, I have selected Do Not Show Subtotals from Subtotals and Show in Tabular Form from Report Layout in the Design tab.
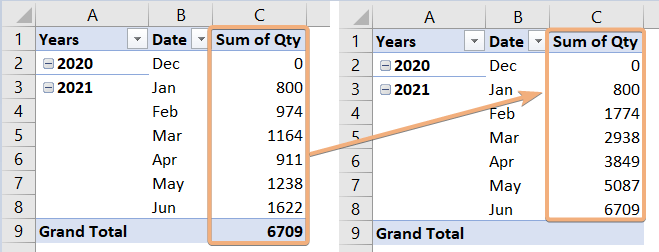
Now, repeat the steps from the previous section to add the running total in the Excel Pivot Table. So, right-click on a cell in the Pivot Table. Then, go to Value Field Settings > Show Values As > RunningTotal In >Base Field > Date.
Running Total in Grouped Dates in Excel Pivot Table
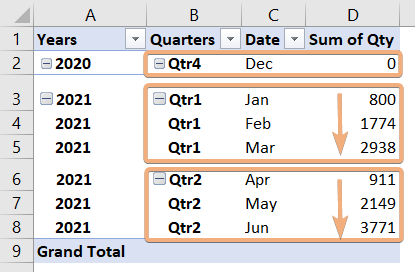
In this Pivot Table, I have added 3 sets of grouped dates. You can see them in the image.

Now, we will add the Running Total in the Excel Pivot Table. To do that, repeat similar steps to add the running total. Navigate to Value Fields Settings> Show Values As> Running Total In. Now, choose Base Field > Date.
Running Total in Pivot Chart in Excel
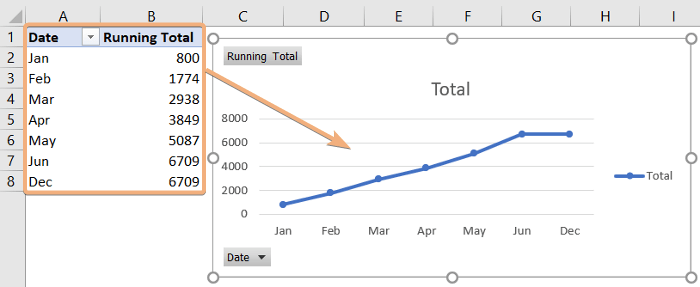
You can insert a Pivot Chart with the running total in Excel to visualize the Pivot Table patterns. To do that, select any cell inside the Pivot Table. Then, go to the Analyze tab > Pivot Chart under the Tools group. Next, select the chart type.
This image shows the trend of running total in the Pivot Chart.
Conclusion
In conclusion, creating a running total in an Excel Pivot Table is a valuable technique for analyzing cumulative values over a sequence of entries. In this article, I have provided a guideline to create a running total in Excel Pivot Table. Besides, I added the running total approach in Excel without the Pivot Table. Additionally, you will learn to add the running total starts from zero, for grouped dates. Lastly, you can also create a Pivot Chart to show patterns, and trends of the Pivot Table with this article. So, start to explore the running total in the Excel Pivot Table.
Frequently Asked Questions
How do I run a calculation in a Pivot Table?
To run a calculation in a Pivot Table, follow these steps:
- Select any cell in the Pivot Table.
- Go to the Analyze tab in the PivotTable Tools.
- Click on the Fields, Items & Sets dropdown and choose Calculated Field.
- In the Insert Calculated Field dialog box, enter a name for the calculated field.
- In the Formula field, create your calculation using available fields and operators.
- Click Add and then OK to apply the calculated field to your Pivot Table.
This allows you to perform custom calculations based on existing fields in your Pivot Table.
How do you calculate a running percentage of total in Excel Pivot Table?
To calculate a running percentage of the total in an Excel Pivot Table, you can use the following steps:
- Click anywhere within the Pivot Table.
- Right-click on it and choose Show Values As.
- Select % Running Total In from the list.
- The Pivot Table will now display a running percentage of the total for each row or column.
This method allows you to analyze the proportional contribution of each item in the Pivot Table to the overall total.
