How to Add a Slicer to a Pivot Table in Excel
Step 1: Prepare the Dataset
In this dataset, I have prepared the data for the sales report. So, this dataset includes category, region, salesman, and the quantity of each product. Then, I will insert and arrange a Pivot Table in Excel. Next, I will add a slicer to the Excel Pivot Table.

Step 2: Arrange and Create Pivot Table
In this section, I will create a Pivot Table. To do that, follow the steps below:
- Select the range.
- Go to the Insert tab > PivotTable dropdown > From Table/Range option.

- Confirm the range, choose the location to place the Pivot Table, and click OK.
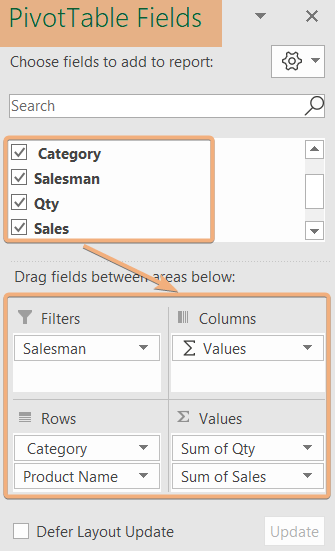
- Drag the field name from the PivotTable Fields pane.
- Put them in the Rows, Columns, Values, and Filters areas.

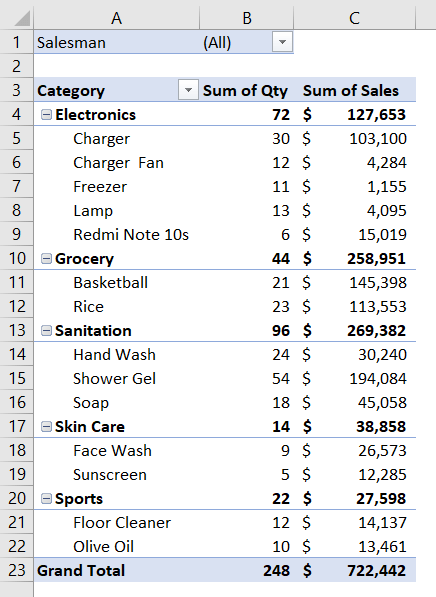
By following these steps, you can create a Pivot Table. In this Pivot Table, I have dragged the category and product name in the Rows, then quantity and sales in the Values section. Additionally, I have added the Salesman in the Filters area.

Step 3: Add Slicer to Filter Data
Let’s add a slicer in the Pivot Table to filter the data in Excel. So, go through the procedure below:
- Select anywhere inside the Pivot Table.
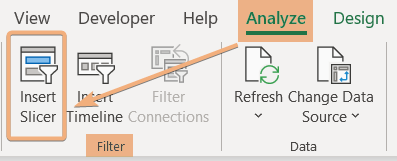
- Navigate to the Analyze tab.

- Click Insert Slicer under the Filter group.
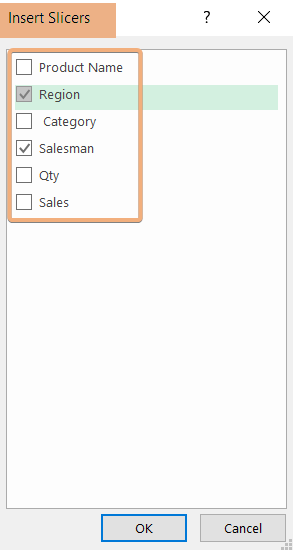
- In the Insert Slicers dialog box, check on the field you want to filter in the Pivot Table.
- Click OK.

- Now, choose the name from the slicers in the Excel Pivot Table.
I have selected Martha in the Salesman and North in the Region. So, this updates the Pivot Table according to the slicer.

Conclusion
In conclusion, incorporating slicers into your Pivot Table workflow not only adds a visual and user-friendly dimension to data analysis but also significantly streamlines the filtering process. The ability to effortlessly interact with and control data through slicers empowers users to navigate and dissect information with precision and ease. In this article, you will get a step-by-step guideline to add a slicer to a Pivot table. Now, you can filter your data with slicers by going through this article.
Frequently Asked Questions
Why can’t I add slicers to my Pivot Table?
Troubleshoot the inability to add slicers to a Pivot Table by checking the following:
- Confirm your Pivot Table is based on a structured Excel Table.
- Select a cell within the Pivot Table before adding a slicer.
- Ensure your Excel version supports slicers (Excel 2013 and later).
- Exit any editing mode on the Pivot Table by clicking outside of it.
- Unprotect the worksheet if it’s protected before adding slicers.
- Define the correct data range for the slicer, including the desired fields.
- Check for blank cells within the slicer’s field.
- Keep Excel updated to resolve any compatibility issues.
- If the problem persists, create a new workbook to rule out corruption.
Remember to save your work before making significant changes to avoid data loss.
How to add multiple slicer items in a Pivot Table?
To add multiple slicer items to a Pivot Table in Excel:
- Click anywhere within the Pivot Table to activate it.
- Go to the Analyze tab on the Excel ribbon and click Insert Slicer.
- In the Insert Slicers dialog box, choose the fields you want to use as slicers and click OK.
- The selected fields will now appear as individual slicers. Resize and arrange them as needed for clarity.
- Click on individual items within a slicer to select them. Hold down the CTRL key to make multiple selections.
By adding multiple slicers and making selections across them, you can precisely filter your Pivot Table data to focus on specific elements, enhancing your ability to analyze and interpret information.
How to clear the filter from the slicer in Excel Pivot Table?
To clear the filter from a slicer in an Excel Pivot Table:
- Activate the slicer by clicking on it within your Excel worksheet.
- Look for the clear filter icon, typically represented by an ‘X’ symbol, within the slicer.
- Simply click on the clear filter icon to remove all selections and clear the filter from the slicer.
Clearing the filter from a slicer allows you to reset the Pivot Table to its original state, displaying all data without any applied filters.
How do I add a filter to a Pivot Table in Excel?
To add a filter to a Pivot Table in Excel, follow these steps:
- Open your Excel workbook and navigate to the worksheet containing the Pivot Table.
- Click anywhere within the Pivot Table to activate it.
- In the PivotTable Fields pane on the right, locate the field you want to filter.
- Drag the field from the Fields list to either the Rows or Values area in the Pivot Table.
- Once the field is added, look for the filter drop-down arrow next to the field name within the Pivot Table.
- Click the filter drop-down arrow, and a list of unique values from the field will appear.
- Unselect the values you want to exclude from the filter or use the search box to find specific items.
- Click OK to implement the selected filter criteria.
Your Pivot Table will now display data based on the applied filter. Adjust filters as needed to analyze specific information within your data set.


