How to Use a Slicer in Multiple Pivot Tables in Excel
In this article, I will describe the Excel slicer multiple Pivot Tables with a step-by-step approach. Firstly, I will create two Pivot Tables, then insert a slicer and create a connection for both. So, explore this article for multiple Pivot Tables with an Excel slicer.
Step 1: Create Multiple Pivot Table
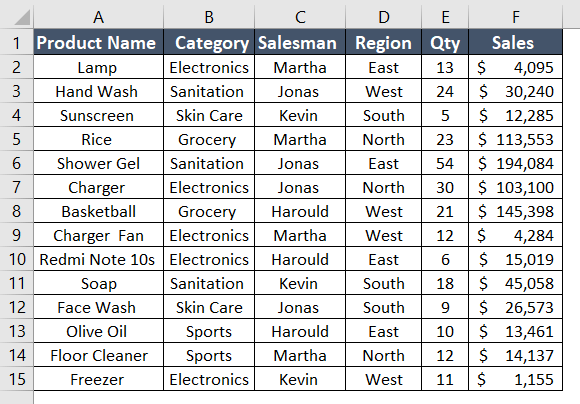
In this Excel workbook, I have a dataset. Now, I will create 2 Pivot Tables in the same worksheet from the dataset. Then, I will insert a slicer for these Pivot Tables.
To create a Pivot Table, follow the steps below:
- Select the entire range.
- Then, go to the Insert tab > PivotTable dropdown > From Table/Range option.
- Confirm the range and choose the location to place the Pivot Table.
- Click OK.
- Repeat the steps and place the Pivot Table in the same worksheet.
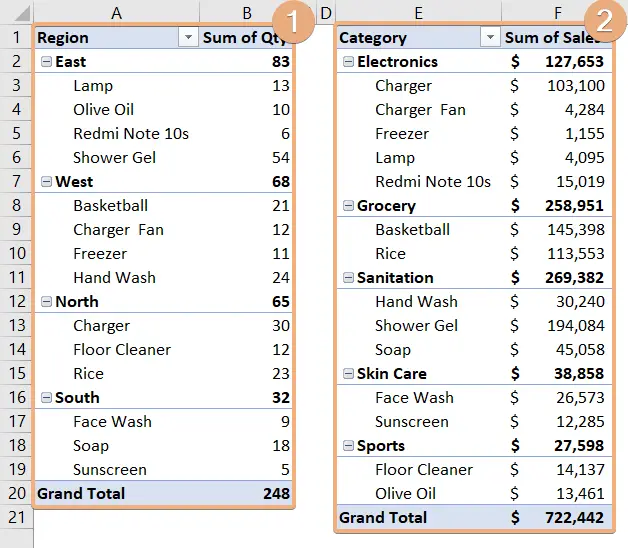
I have organized the Pivot Tables from the PivotTable Fields pane. Hence, this image shows the created Pivot Tables from the datasets.
Step 2: Insert a Slicer for Pivot Tables
In this step, I will insert a slicer to filter the Pivot Table data. To do that, go through the steps below:
- Click anywhere inside the Pivot Table.
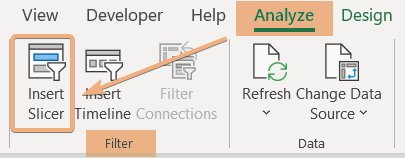
- Navigate to the Analyze tab.
- Go to the Filter group.
- Click on the Insert Slicer tool.

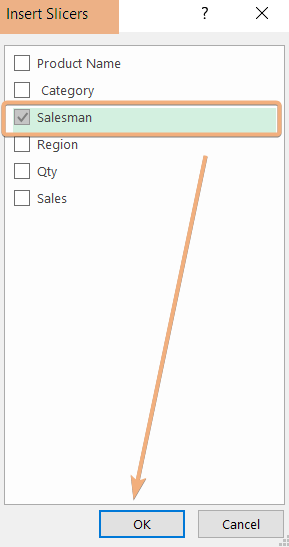
- In the Insert Slicers dialog box, check on the field name and click OK.

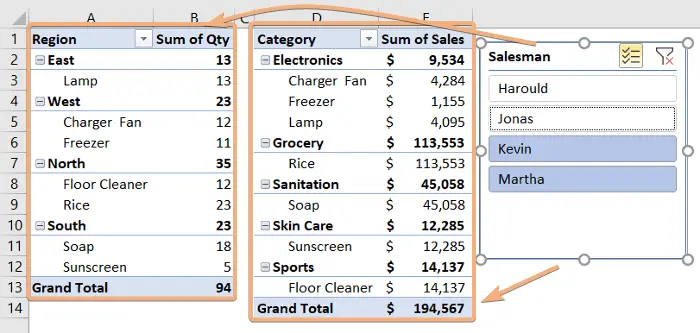
After completing the above procedure, you will see a list of the items in the slicer. In this Excel worksheet, I have chosen the salesman as a slicer.

Step 3: Create Connection for Multiple Pivot Tables
Let’s move forward to create a connection between the inserted slicer for multiple Pivot Tables. Now, follow the procedure to connect the slicer with both the Pivot Table:
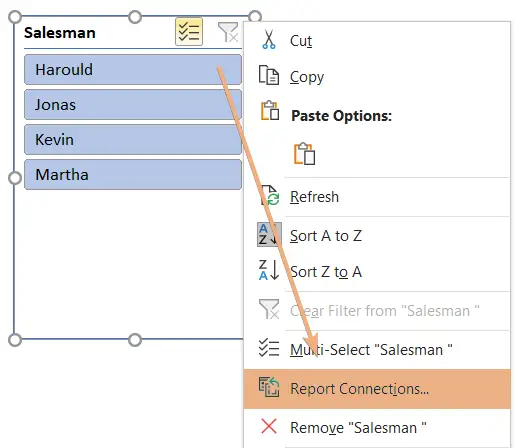
- Right-click on the inserted slicer.
- Click on the Report Connections.

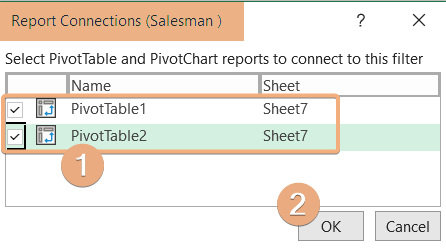
- Check on the sheets’ names and click OK.

By doing these, you can create a connection between multiple Pivot Tables. Now, you can select the item’s name to filter the Pivot Tables simultaneously. Here, I have chosen ‘Kevin’ and ‘Martha’ in the salesman slicer to filter Pivot Tables.
Conclusion
In conclusion, leveraging Excel slicers across multiple Pivot Tables empowers users to elevate their data analysis capabilities. By seamlessly connecting one slicer to multiple data sources, this feature not only simplifies the filtering process but also ensures a synchronized and cohesive exploration of diverse datasets. The ability to control and harmonize multiple Pivot Tables with a single slicer enhances efficiency, allowing for a more streamlined and intuitive analytical workflow. In this article, I have provided a step-by-step guideline for Excel slicer in the multiple Pivot Tables. After going through this article, you will be able to create a connection with multiple Pivot Tables through a slicer.
Frequently Asked Questions
What is a slicer and sync slicer?
Slicer and Sync Slicer are features commonly found in data visualization tools like Microsoft Excel or Power BI.
- Slicer: A slicer is a user interface element that allows you to filter and interact with data in a visual or dashboard. It typically presents a set of buttons representing a unique value or category, enabling users to easily filter data by selecting specific options. Slicers enhance the interactivity of reports and dashboards, providing a more intuitive way to explore and analyze data.
- Sync Slicer: Sync Slicer is a related feature that synchronizes multiple slicers across different visualizations or pages within a report. When you make a selection in one slicer, all synchronized slicers automatically adjust to reflect the same filter criteria. This ensures consistency in data exploration and analysis across various report parts, offering a streamlined and cohesive user experience.
In summary, slicers offer a user-friendly filtering mechanism, while sync slicers enable the seamless coordination of filtering choices across multiple components of data visualization.
How do I filter multiple pivot tables in Excel?
To filter multiple Pivot Tables in Excel:
- Click on any cell within the first Pivot Table that you want to filter.
- Go to the Insert tab on the Excel ribbon, click on Slicer, and choose the fields you want to filter. Slicer buttons will appear.
- Use the slicer buttons to filter data in the first Pivot Table.
- Right-click on the slicer, choose Report Connections and select the additional Pivot Tables you want to filter.
- Now, when you use the slicer to filter data in the first Pivot Table, all linked Pivot Tables will automatically reflect the same filter criteria.
By following these steps, you can efficiently filter multiple Pivot Tables in Excel using slicers, ensuring synchronized data analysis across various tables in your workbook.
How do I connect one slicer to two data sources?
To connect one slicer to two data sources in Excel:
- Generate Pivot Tables from both data sources that you want to connect.
- Go to the Insert tab on the Excel ribbon, click on Slicer, and select the fields you want to filter.
- Right-click on the slicer, choose Report Connections, and select both Pivot Tables. This links the slicer to the two data sources.
- Ensure that the slicer is configured to control both Pivot Tables. Right-click on the slicer, choose Slicer Settings and confirm that both Pivot Tables are selected.
- Use the slicer to filter data in both Pivot Tables simultaneously. Any selection made in the slicer will affect both connected data sources.
By following these steps, you can effectively connect one slicer to two different data sources, allowing for synchronized filtering across multiple Pivot Tables in Excel.
How to lock the slicer position?
To lock the position of a slicer in Excel:
- Click on the slicer you want to lock.
- Right-click on the slicer, and choose Size and Properties.
- In the Format Slicer pane, navigate to the Position & Layout section. Look for options such as ‘Move but don’t size with cells‘ or ‘Lock aspect ratio‘ depending on your preference.
- Check the box or select the option that indicates locking the position of the slicer. This ensures that the slicer remains fixed in its position even if you resize or move cells in the worksheet.
By following these steps, you can effectively lock the position of a slicer in Excel, providing stability to its location on the worksheet.
