Pivot Table Slicer Vs Filter in Excel
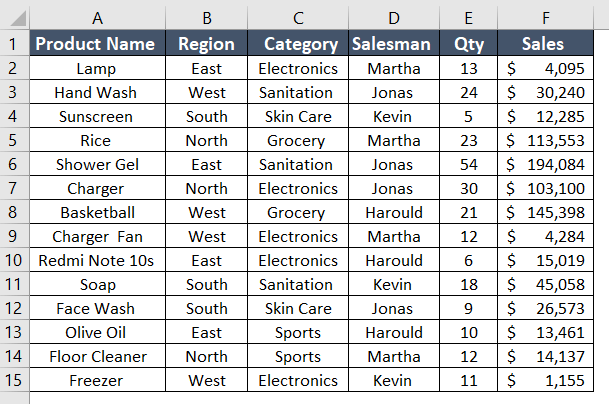
The dataset contains a sales report in Excel. So, it includes the name of the products with their category, region, salesman, and quantity. Then, I will insert a Pivot Table to compare the Pivot Table slicer and filter in the later part of the article.
Difference Between Pivot Table Slicer and Filter in Excel
Pivot Table Filters and Slicers are crucial for effective data analysis and presentation. These features play pivotal roles in shaping how data is filtered and visualized, each offering a unique advantage. Here are the key differences between them:
| Aspect | Pivot Table Filter | Pivot Table Slicer |
|---|---|---|
| Purpose | Filters data within PivotTable columns and rows. | Provides a visual way to filter data specifically designed for Pivot Tables and Pivot Charts. |
| User Interface | Dropdown menus for selecting values or conditions. | Separate visual control with buttons for an intuitive and graphical interface. |
| Scope of Impact | Affects the entire PivotTable and connected Pivot Charts. | Filters data for connected PivotTable or Pivot Chart, allowing more focused control. |
| Connection to Multiple Objects | Applied to individual fields within the Pivot Table. | Can be linked to multiple PivotTables and Pivot Charts, ensuring consistent filtering. |
| Visual Representation | A primarily text-based interface displaying selected values. | Graphical representation through buttons for a more intuitive interaction. |
| Ease of Use | Requires interacting with dropdowns and checkboxes. | Provides a user-friendly, click-and-select interface. |
| Visibility | Displayed within the Pivot Table area. | Appears as a distinct visual element, making it more prominent. |
In summary, while both Pivot Table Filters and Slicers serve the purpose of filtering data in Excel, Slicers are specifically designed for Pivot Tables and Pivot Charts, offering a more visual and user-friendly way to interact with and analyze data.
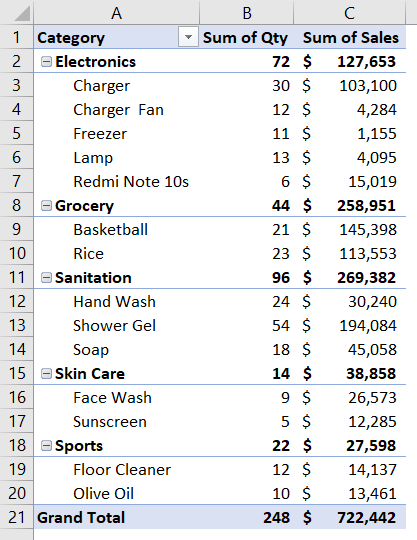
To compare the Pivot Table slicer and filter, I have inserted a Pivot Table. Here, I have dragged the category and product name in Rows, quantity, and sales in Columns.
How to Apply Slicer and Filter in Excel Pivot Table
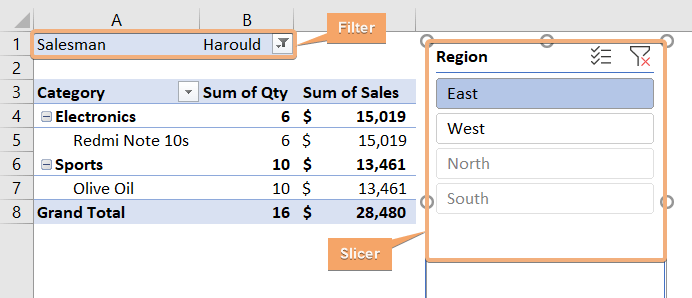
In this Pivot Table, I have applied a Pivot Table Filter and Slicer simultaneously. So, I have added the salesman header in the Filters area in the PivotTable Fields. Then, I have also included a slicer and selected region in the slicer.
The attached image shows the filtered output of a Pivot Table using a Filter and Slicer.
Now, we will learn to insert slicer and filter in the Excel Pivot Table.
How to Add a Slicer in Excel Pivot Table
Let’s learn to add a slicer in the Excel Pivot Table. To do that, follow the procedure below:
- Select any cell inside the Pivot Table.
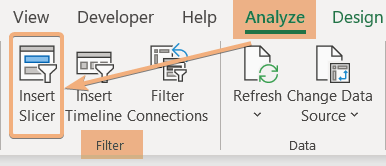
- Go to the Analyze tab in the PivotTable Tools.
- Choose Insert Slicer under the Filter group.

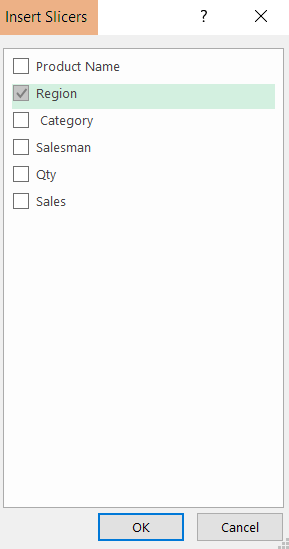
- Select the field name in the Insert Slicers dialog box and click OK.

This will update the Pivot Table with the slicer. Now, you can just click on the item name and filter the Pivot Table data. Here I have selected East in the Region field.

How to Use Filter in Pivot Table
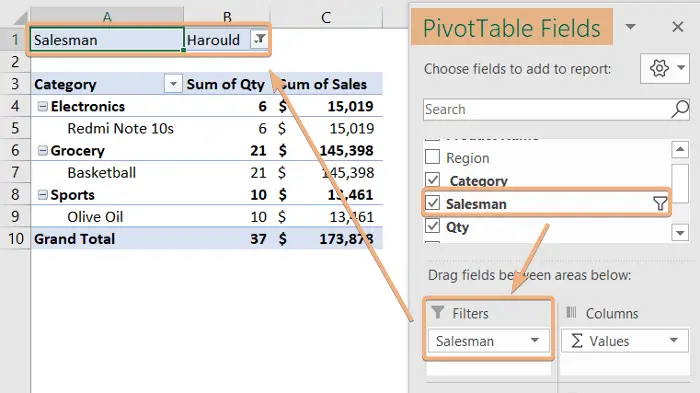
Now, add a field in the Filters area of the PivotTable Fields pane. Now, go through the steps below:
- Select the field you want to add to filter data.
- Drag the field and put it into the Filters area.
I have dragged the salesman in the filters area. Then, I chose Harould in the Salesman field.
Conclusion
In conclusion, the choice between using a Pivot Table Slicer and Filter in Excel ultimately depends on the nature of your data analysis needs and your preferred user experience. While both tools serve the common purpose of refining and interacting with data within PivotTables, they offer distinct advantages. In this article, I have discussed the Pivot Table slicer vs filter in Excel. Additionally, I have added the procedure to add a slicer and filter in the Excel Pivot Table. So, explore it with this article.
Frequently Asked Questions
What is the purpose of Pivot Table slicers?
The purpose of Pivot Table slicers in Excel is to provide a visual and user-friendly interface for filtering and controlling data within Pivot Tables. Slicers function as interactive, customizable buttons that allow users to easily filter data based on specific criteria. By selecting slicer items, users can dynamically adjust and analyze Pivot Table information, enhancing the overall interactivity and usability of Excel spreadsheets. Slicers simplify the filtering process, offering an intuitive way to explore and dissect data, ultimately improving the efficiency and effectiveness of data analysis in Excel.
Why are slicers better than filters in Excel?
Slicers are often considered better than traditional filters in Excel due to their visual simplicity and enhanced user experience. Unlike filters, slicers provide a user-friendly, interactive interface with customizable buttons, allowing for intuitive and quick data manipulation. The visual clarity of slicers makes it easier to understand and control filtering criteria, especially when dealing with complex datasets.
Moreover, slicers offer a consolidated view of available filter options, making it more convenient for users to select multiple items simultaneously. Slicers also sync across multiple Pivot Tables, streamlining the analysis of interconnected data sets.
In summary, the visual appeal, ease of use, and seamless integration across Pivot Tables make slicers a preferred choice for enhancing the filtering experience in Excel compared to traditional filters.
Are slicers only for Pivot Tables?
No, slicers are not exclusive to Pivot Tables in Excel. While commonly associated with Pivot Tables, slicers can also be used with regular Excel tables and data ranges. Slicers provide a visual and user-friendly way to filter data, enabling users to interactively control and analyze information in various Excel components beyond Pivot Tables. Whether working with Pivot Tables, Excel tables, or data ranges, slicers offer a versatile and intuitive tool for enhancing the filtering experience and facilitating efficient data exploration.
Is the slicer used for filtering data?
Yes, a slicer in Excel is primarily used for filtering data. Slicers provide a visual and user-friendly interface for selecting and controlling specific data subsets within Excel components like Pivot Tables and tables. By interacting with slicers, users can easily filter and analyze data, making it a powerful tool for enhancing the overall data exploration and analysis experience in Excel.
How to Add a Slicer to Pivot Chart?
To add a slicer to a Pivot Chart in Excel, follow these steps:
- Create a Pivot Table: Start by creating a Pivot Table from your dataset. Select the data, go to the Insert tab, and click on PivotTable. Choose the location for the PivotTable and click OK.
- Generate a Pivot Chart: After creating the Pivot Table, highlight the data, go to the Insert tab, and select the desired chart type from the Charts group. This will generate a Pivot Chart linked to your Pivot Table.
- Insert a Slicer: Click anywhere on your Pivot Chart to activate it. Next, go to the Insert tab and click on Slicer in the Filter group. Choose the fields you want to use as filters in your slicer and click OK.
- Format and Arrange the Slicer: The slicer will appear as a separate window containing filter options. Arrange and format it as needed by clicking and dragging its edges. You can also customize the slicer’s appearance and size.
- Filter the Pivot Chart using the Slicer: Click on the slicer buttons to filter the data displayed in the Pivot Chart instantly. This provides a user-friendly and dynamic way to interact with your data visually.
By following these steps, you can seamlessly add a slicer to your Pivot Chart in Excel, allowing for efficient and interactive data exploration.
